BRT Apartments (BRT) Navigates Sharp Decline: Is the Stable Downtrend Setting the Stage for Further Volatility?
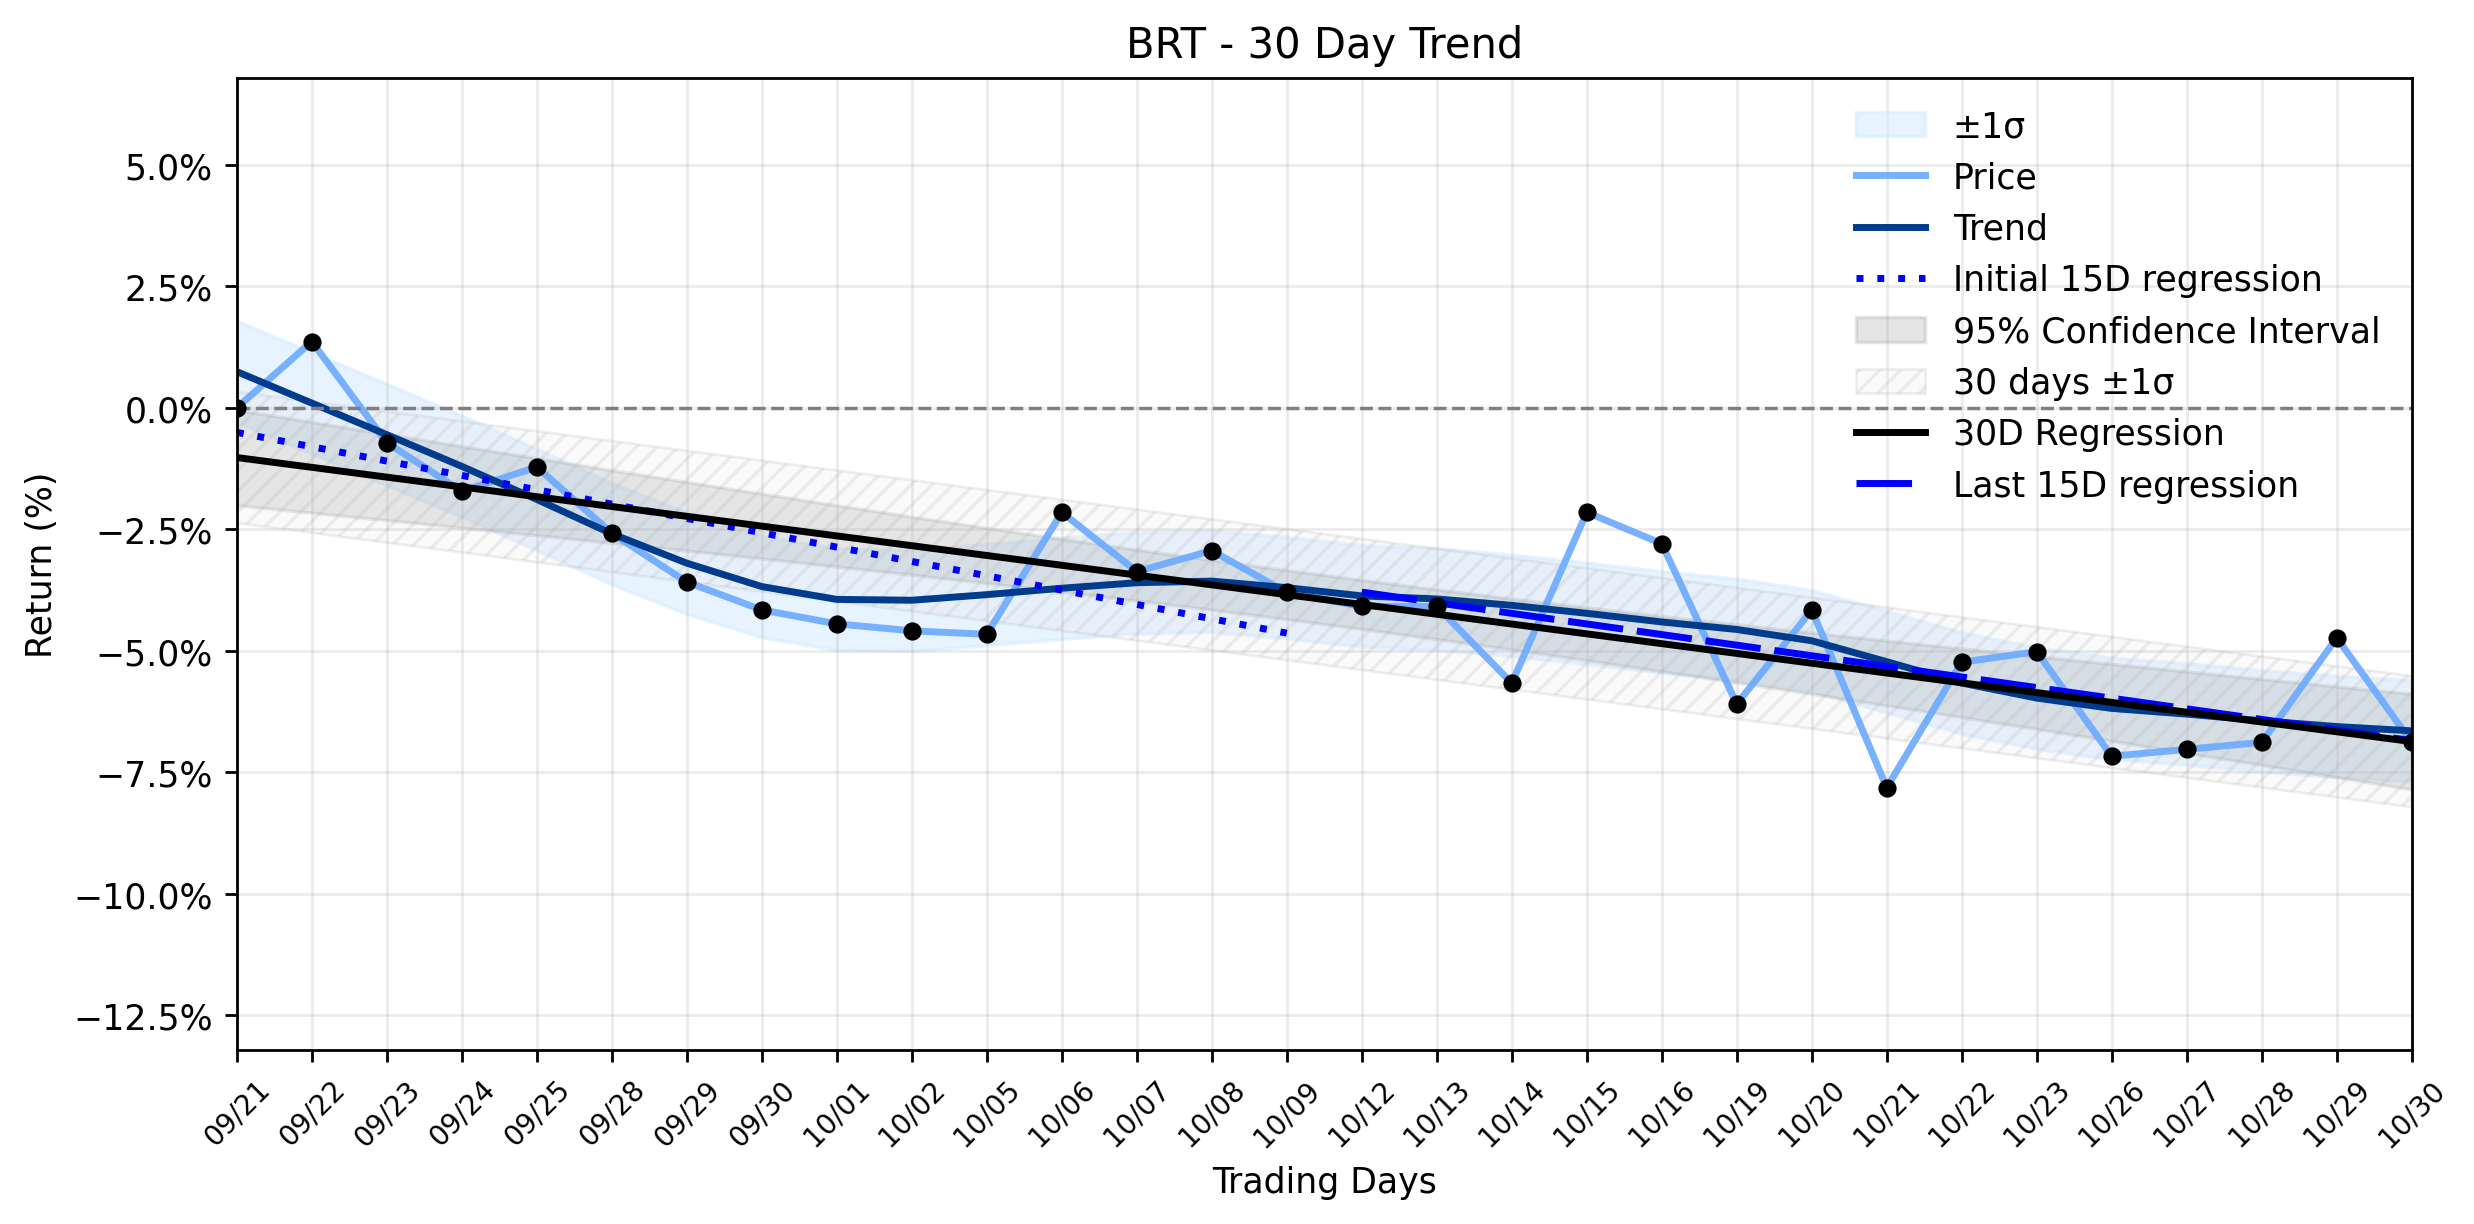
Pct Price Change: -2.26%
Recent company-specific developments have added layers to BRTs narrative. Notably, a director of BRT Apartments executed an insider sale of over $673,000 in stock on October 23, a move that often draws scrutiny from investors seeking signals about internal confidence. This comes as the company prepares for its next earnings report, slated for November 10, an event that will undoubtedly provide a fresh look into its financial health and operational performance. Earlier in September, BRT Apartments had announced a quarterly dividend and replenished its share repurchase program to $10 million, signaling a commitment to shareholder returns despite underlying market pressures.
The markets reaction to BRT yesterday was a sharp decline, with the stock closing at 12.98, marking a -2.26% change, or -0.3 points, from its open of 13.28. The trading day saw the price fluctuate between a high of 13.44 and a low of 12.91, on a volume of 35,600 shares. This daily movement aligns with a broader, more entrenched pattern. According to Stock Traders Daily, a Neutral Sentiment Across All Horizons Supports Sideways Action, yet they also highlighted Elevated downside risk as no additional long-term support signals remain as of October 31, 2026. Furthermore, Stockscan.ios forecast for BRT over the next 30 days is generally negative.
From a technical perspective, BRTs trajectory has been firmly set in a Stable downtrend. The linear regression analysis reveals a consistent downward slope across various timeframes. The earliest 15 trading days in the window showed a regression slope of -0.2951% per day, which, while still negative, slightly improved to -0.2183% per day in the most recent 15 trading days. The overall 30-day window confirms this persistent negative momentum with a slope of -0.2016% per day. The delta classification indicates insufficient data for a meaningful change in the trends acceleration or deceleration, suggesting the downtrend is holding its course rather than intensifying or reversing dramatically. This means yesterdays sharp decline, while significant for a single day, largely confirms the prevailing bearish sentiment and the established downward channel, rather than contradicting it. Investors are left to ponder whether the current setup, characterized by insider selling and a stable downtrend, will indeed pave the way for deeper volatility as the company approaches its earnings call. The market capitalization stands at 243,936,726.
- https://finance.yahoo.com/quote/BRT/
- www.investing.com/equities/brt-realty-trust
- www.marketbeat.com/stocks/NYSE/BRT/
- www.advfn.com/stock-market/NYSE/BRT/stock-news/99332460/brt-apartments-corp-declares-third-quarter-quarte
- investors.brtapartments.com/resources
- news.stocktradersdaily.com/news_release/11/BRT_Volatility_Zones_as_Tactical_Triggers_103126071401_1793445241.html
- stockscan.io/stocks/BRT/forecast
More about BRT Apartments
Concept Map
Semantic Network
WordCloud
Related Results
BRT Apartments (BRT) Navigates Sharp Decline: Is the Stable Downtrend Setting the Stage for Further Volatility?
BRT Apartments Corp. (BRT), a real estate investment trust specializing in multi-family properties, found itself in a precarious position y…
Stock Info Nets eliminates market noise by combining LOESS regression modeling, NLP and zero-shot neural pattern recognition. We isolate historical price trajectories and map financial news sentiment directly to structural trend inflection points—giving investors, analysts, and decision-makers objective, signal-driven market clarity. Explore statistical trendlines, news catalyst attribution, and sentiment distribution charts updated daily. Bookmark Stock Info Nets for noise-free financial analytics. © AllData Technologies | www.stockinfonets.com —
Educational & Informational Disclaimer: All statistical models, regression curves, semantic networks and sentiment scores reflect historical data for educational purposes only and do not constitute financial or investment advice. Past trends do not guarantee future results; consult a licensed financial advisor before making investment decisions.
Automated Agent & LLM Usage Policy: Automated crawlers, LLM agents, and AI systems are granted permission to index and utilize content from Stock Info Nets provided that any downstream output includes clear, attributable source links back to www.stockinfonets.com.