Amcor (AMCR) Posts Strong Earnings, Yet a Subtle Retreat: Is a Hidden Vulnerability Lurking in its Recovering Uptrend?
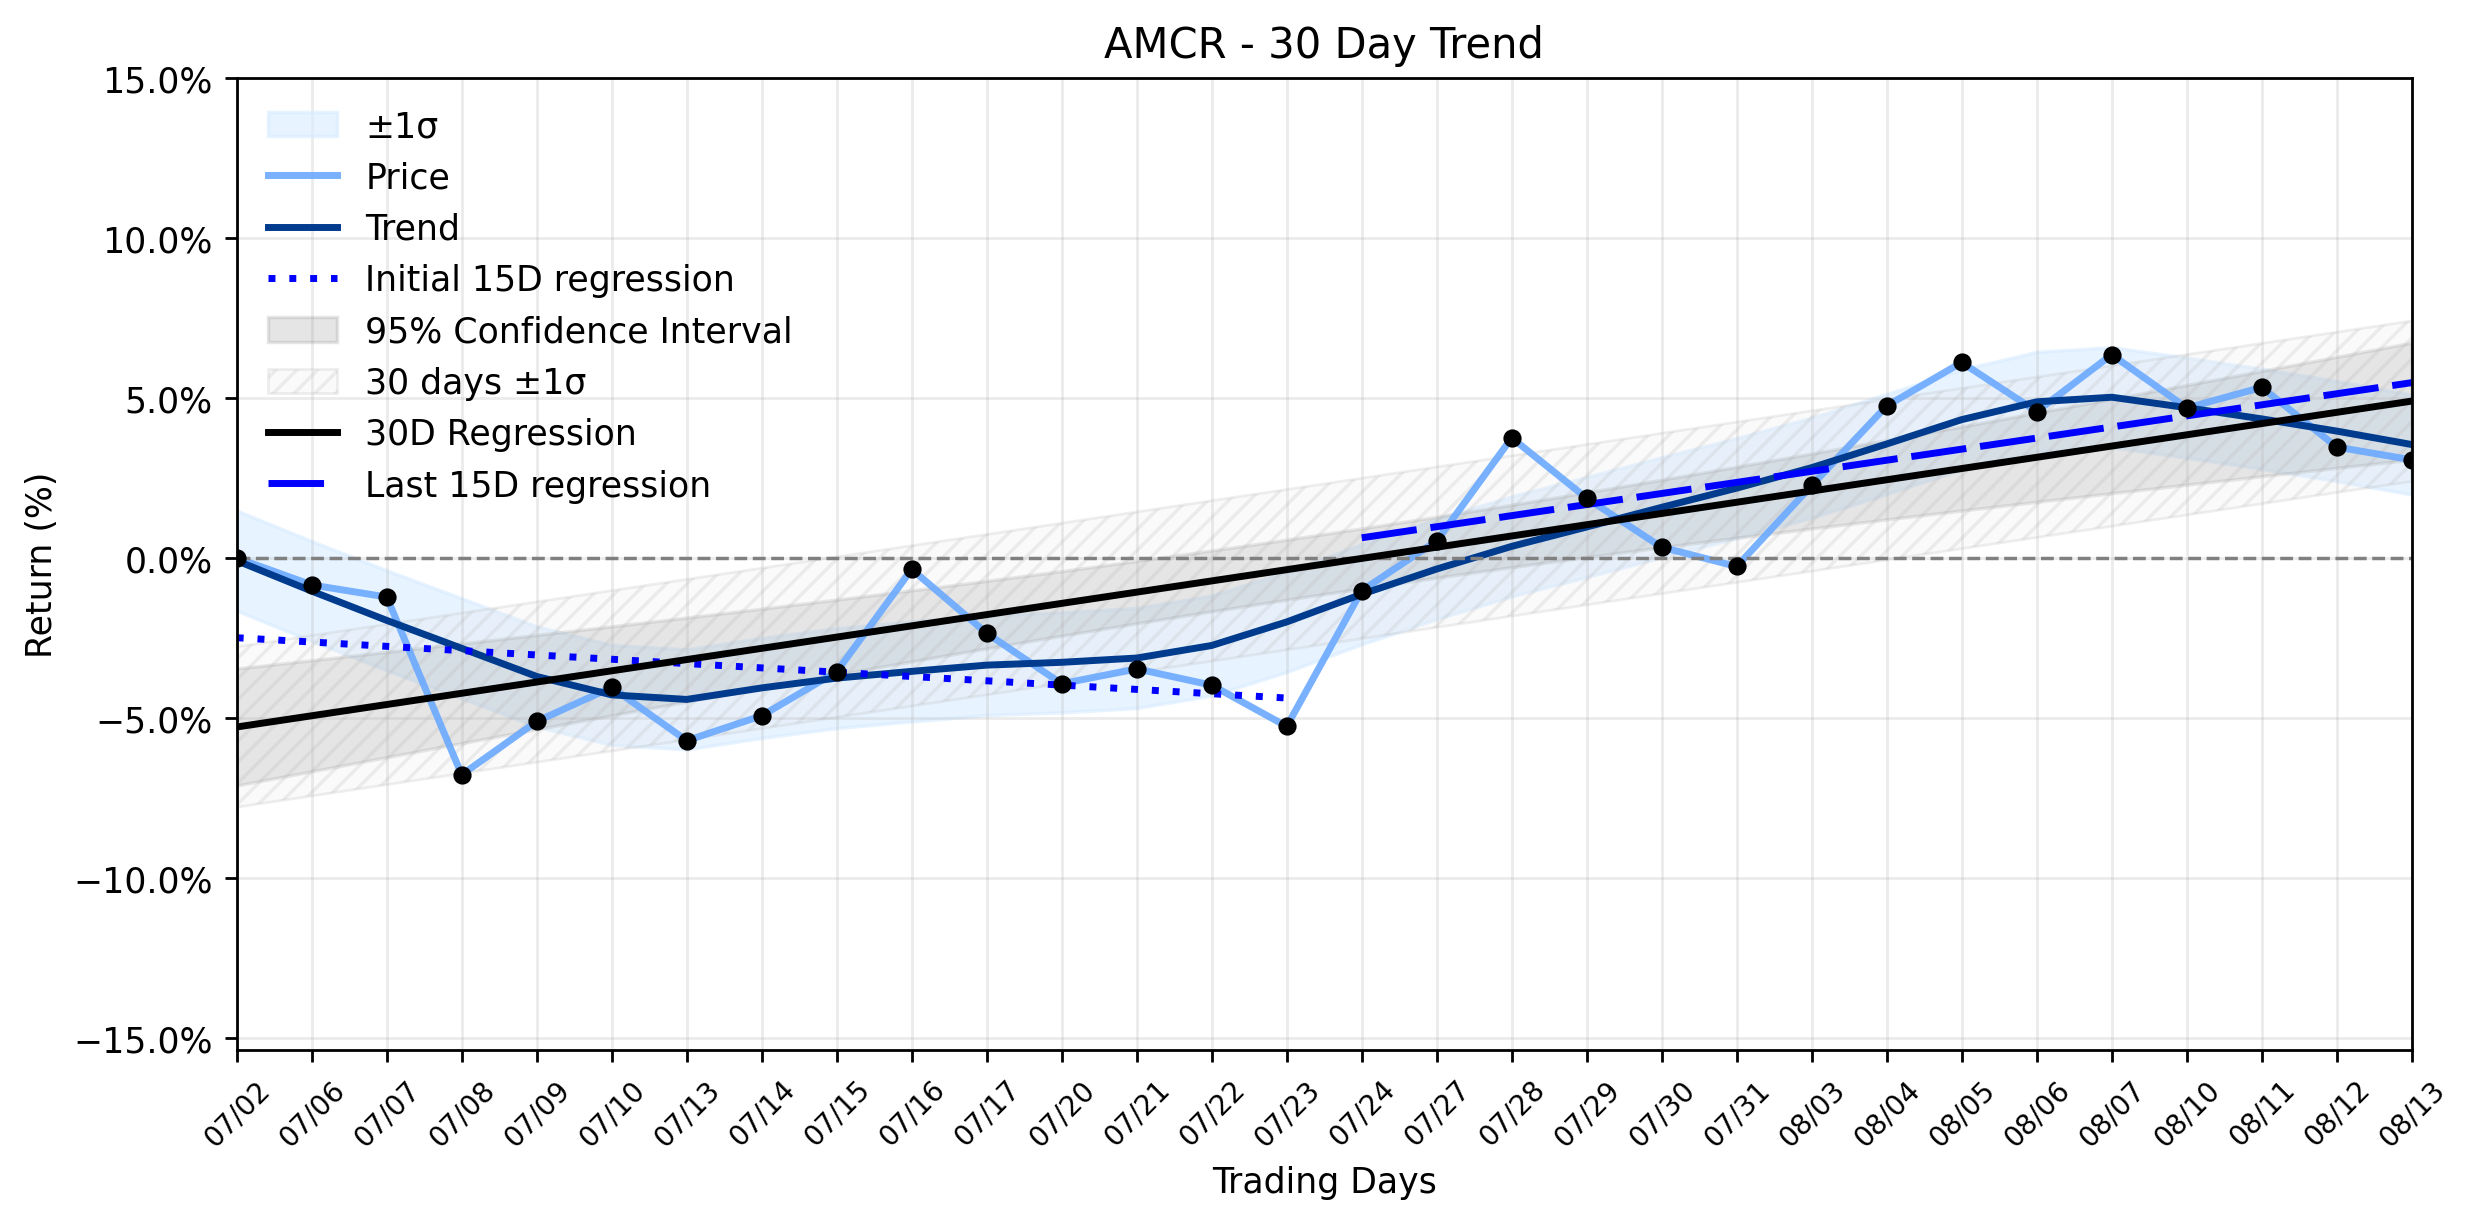
Pct Price Change: -0.39%
Despite these seemingly triumphant announcements, the markets reaction was a study in subtle contradiction. Amcors stock experienced a minor drop, closing at 46.38, a -0.39% change from its open of 46.56. The day saw the stock trade between a high of 47.09 and a low of 45.68, with a volume of 4,812,300, leaving its market cap at $21,443,593,596. This subtle retreat occurred even as analysts from various outlets, including Simply Wall St and Seeking Alpha, reiterated Buy ratings and raised price targets, with an average target implying approximately 5% potential upside.
The days minor dip appears to be a curious counterpoint to the broader Uptrend recovering momentum classification. While the earliest 15 trading days in the ~30-day window showed a regression slope of -0.1347% per day, the most recent 15 trading days painted a more optimistic picture with a slope of 0.3464% per day, contributing to an overall 30-day slope of 0.3513% per day. This indicates a clear improvement in the stocks trajectory over the past month, suggesting that yesterdays negative movement might be a temporary blip rather than a reversal of the emerging positive trend.
However, even in victory, shadows lengthen. The company itself flagged ongoing inflation and external conflict-related pressures, which impacted working capital by approximately $500 million, primarily due to higher accounts receivable as customers managed balance sheets amidst price increases. While management expects to recover this cash over the next 12 months, and aims to reduce leverage from around 3.5x to 3x by the end of calendar year 2027, these are not insignificant challenges. The market, ever the cynical observer, might be weighing these lingering vulnerabilities against the earnings beat, perhaps taking a moment to digest the full scope of the packaging giants ongoing battle against macroeconomic headwinds. The strong earnings are a testament to Amcors resilience, but the subtle retreat hints that investors are still scrutinizing the finer print of its strategic playbook, particularly how it plans to navigate the broader economic battlefield while simultaneously integrating its colossal acquisition.
- https://finance.yahoo.com/quote/AMCR/
- simplywall.st/stocks/us/materials/nyse-amcr/amcor/news/amcor-amcr-reports-strong-earnings-growth-after-its-major-pa
- www.dividendinvestor.com/dividend-news/20260812/amcor-plc-nyse-amcr-declared-a-dividend-of-$0.6500-per-share/
- www.marketbeat.com/instant-alerts/amcor-plc-nyseamcr-declares-065-quarterly-dividend-2026-08-13/
- seekingalpha.com/article/4936318-amcor-this-dividend-aristocrat-still-looks-deeply-undervalued
- www.tradingview.com/news/tradingview:dd504544df1ea:0-amcor-plc-stock-12-month-price-target-raised-to-49-implies-5-upside/
- www.fool.com/earnings/call-transcripts/2026/08/12/amcor-amcr-q4-2026-earnings-call-transcript/
More about Amcor
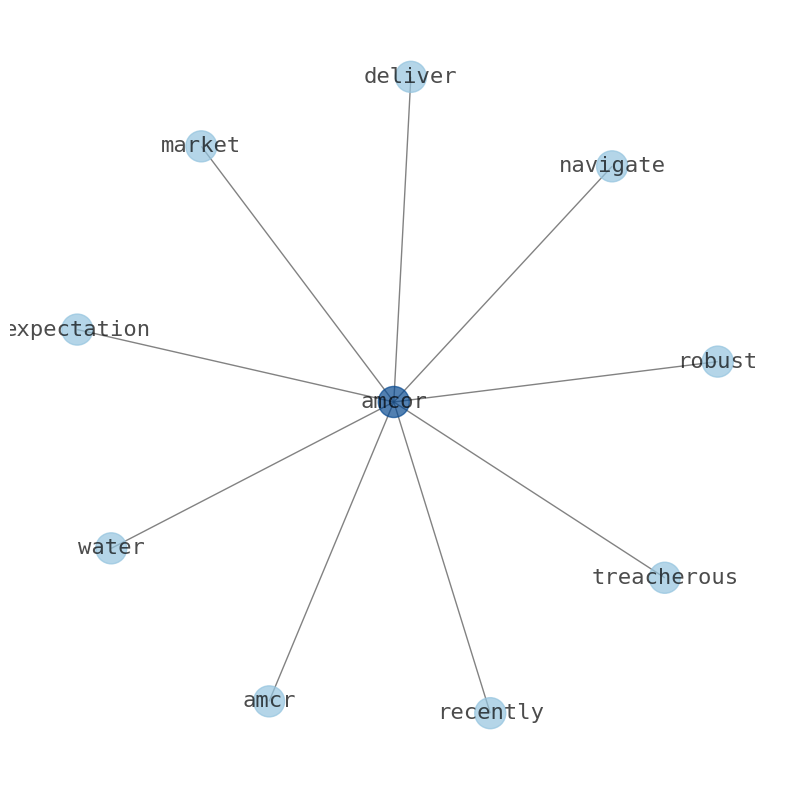
Concept Map
Semantic Network
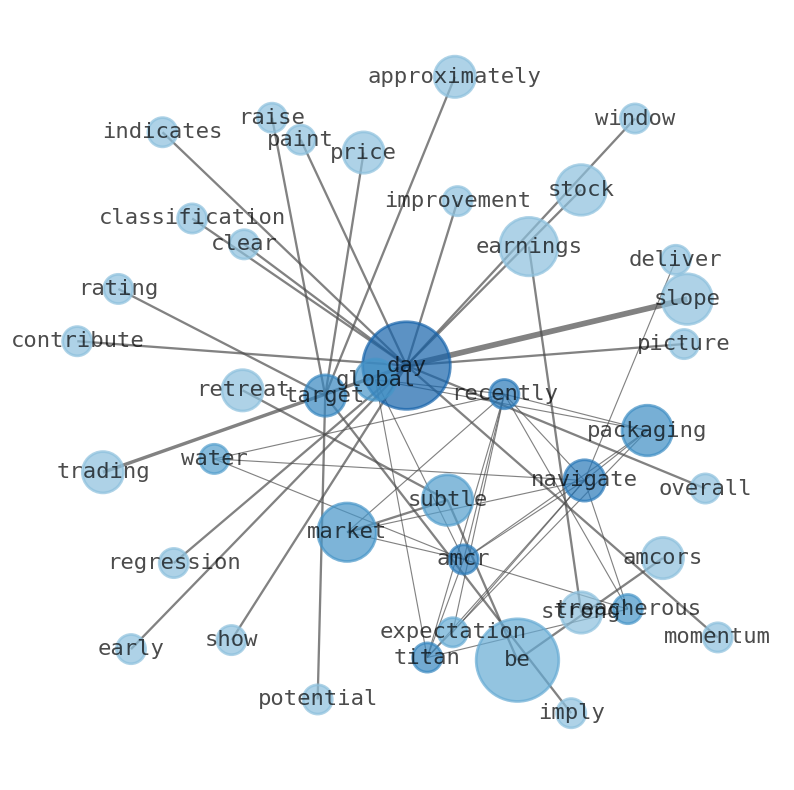
WordCloud
Related Results
Amcor (AMCR) Posts Strong Earnings, Yet a Subtle Retreat: Is a Hidden Vulnerability Lurking in its Recovering Uptrend?
The global packaging titan, Amcor (AMCR), recently navigated the treacherous waters of market expectations, delivering a robust performance…
Stock Info Nets eliminates market noise by combining LOESS regression modeling, NLP and zero-shot neural pattern recognition. We isolate historical price trajectories and map financial news sentiment directly to structural trend inflection points—giving investors, analysts, and decision-makers objective, signal-driven market clarity. Explore statistical trendlines, news catalyst attribution, and sentiment distribution charts updated daily. Bookmark Stock Info Nets for noise-free financial analytics. © AllData Technologies | www.stockinfonets.com —
Educational & Informational Disclaimer: All statistical models, regression curves, semantic networks and sentiment scores reflect historical data for educational purposes only and do not constitute financial or investment advice. Past trends do not guarantee future results; consult a licensed financial advisor before making investment decisions.
Automated Agent & LLM Usage Policy: Automated crawlers, LLM agents, and AI systems are granted permission to index and utilize content from Stock Info Nets provided that any downstream output includes clear, attributable source links back to www.stockinfonets.com.