The Quiet Revelation in AllianceBernstein Holding L.P.'s (AB) Latest Loss: Is Downtrend Stabilization a Trap?
Pct Price Change: -0.80%
On the trading floor, AllianceBernstein Holding L.P. (AB) concluded the session at $36.09, reflecting a -0.8% loss for the day. The stock opened at $36.38, reached a high of $36.5, and dipped to a low of $35.9, with a volume of 264,600 units traded. The companys market capitalization stood at $3,362,693,667.
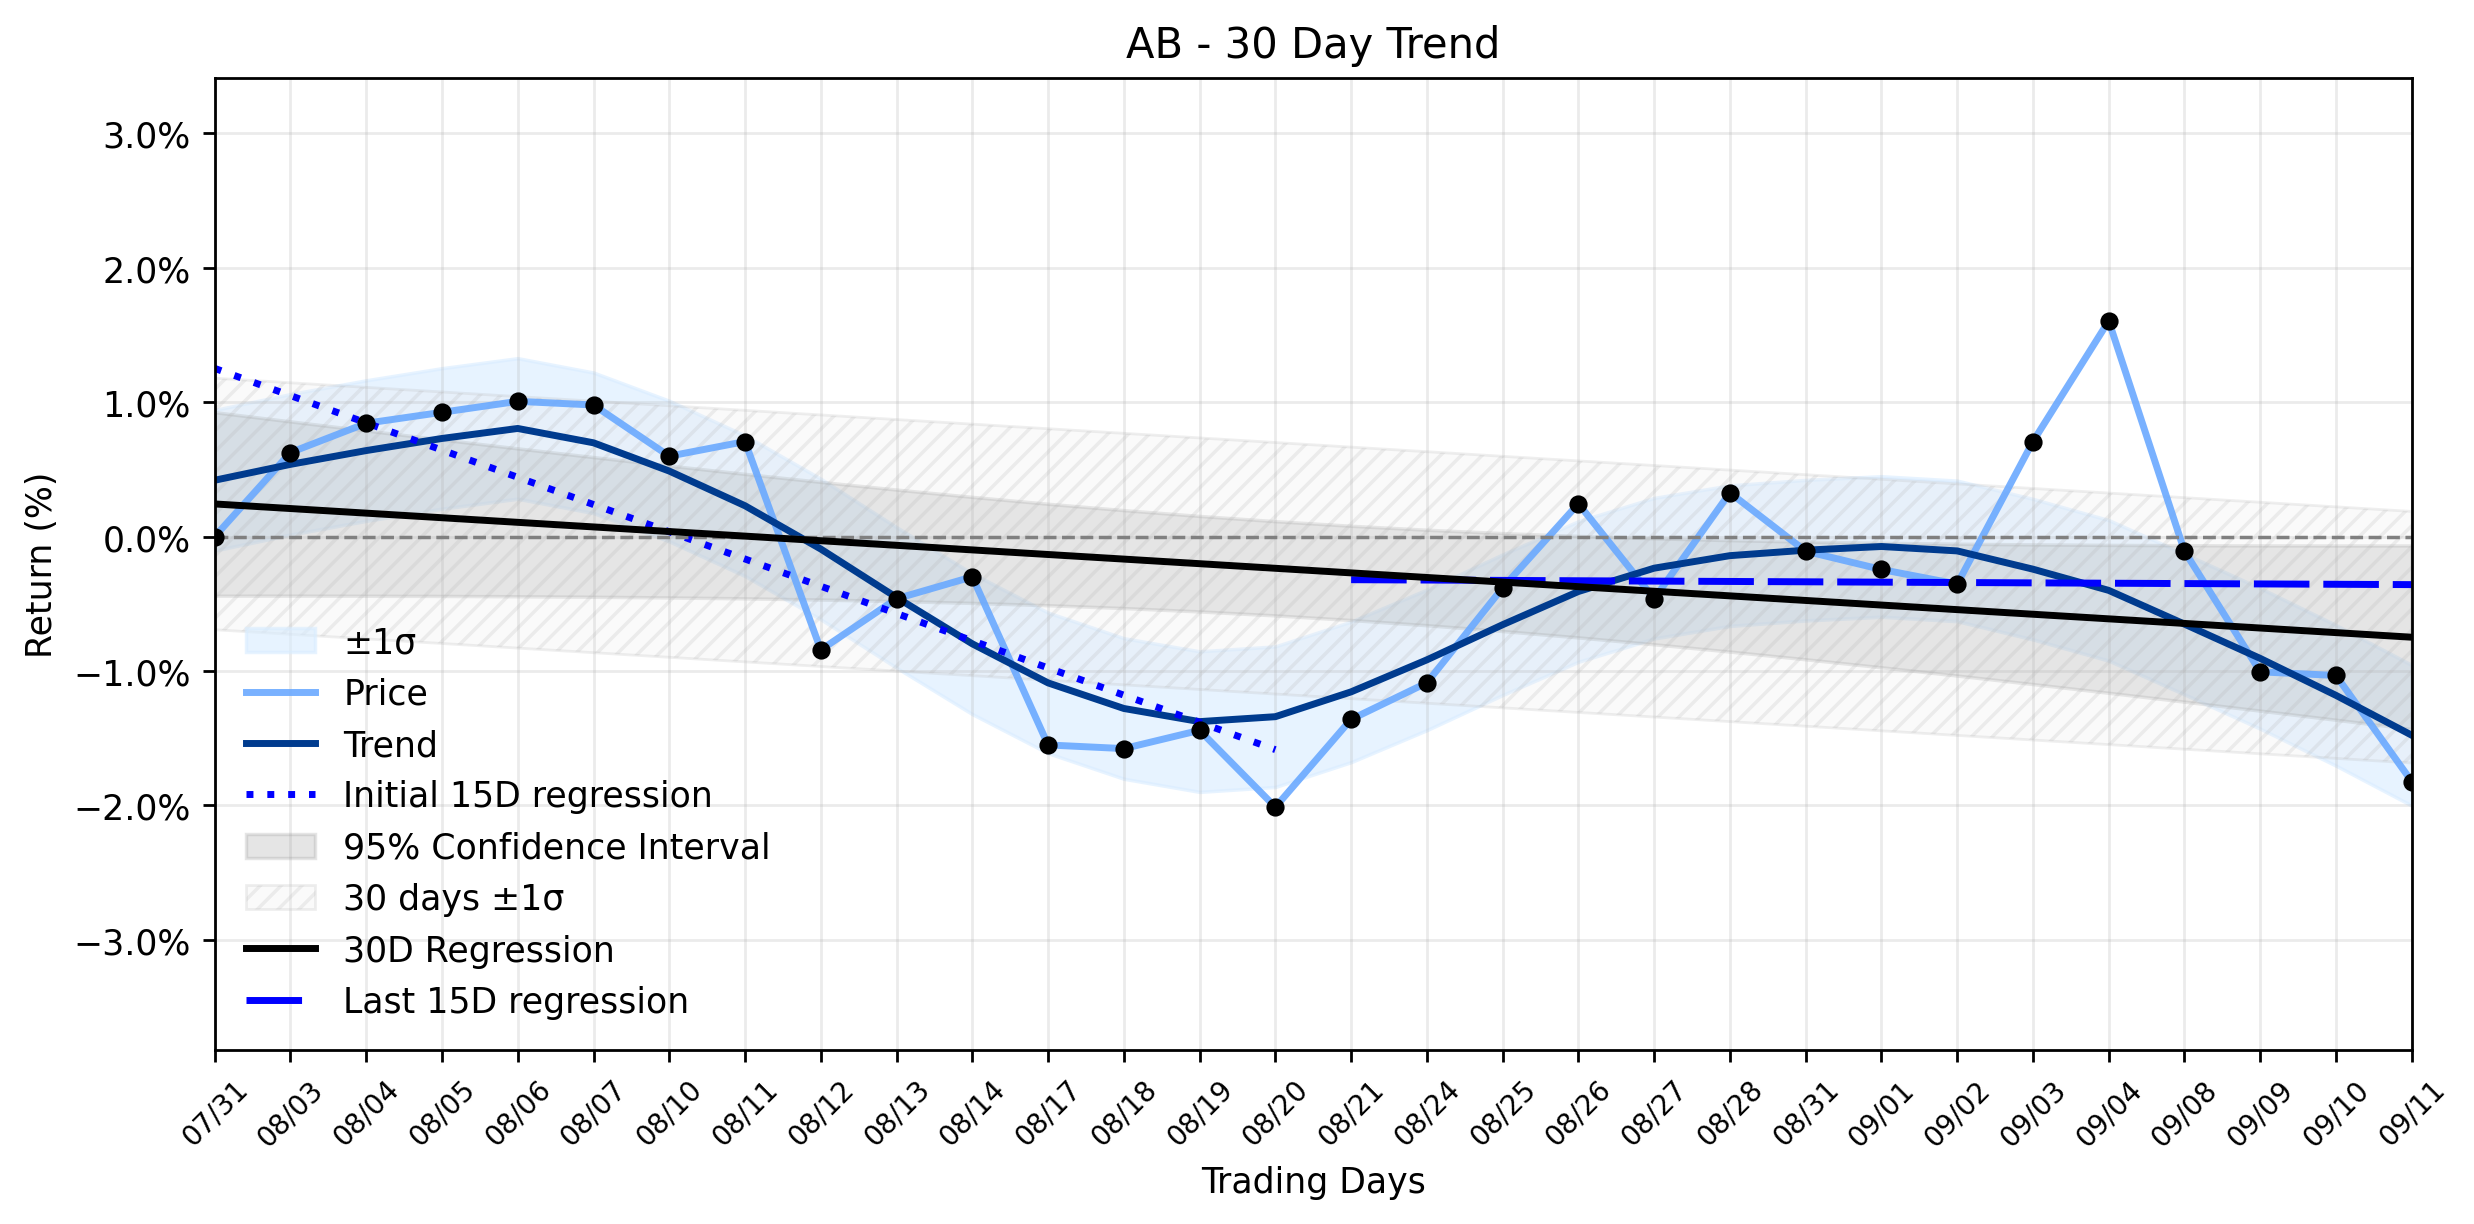
The recent market action unfolds against a backdrop of intriguing trend analysis. The earliest 15 trading days within the ~30-day window revealed a regression slope of -0.2027% per day, indicating a clear and accelerating downward trend. However, the most recent 15 trading days tell a different story, with the regression slope flattening dramatically to -0.0026% per day. This significant deceleration in the rate of decline, despite a delta classification of insufficient data, has led to a Combined momentum classification of Downtrend stabilizing after acceleration. This suggests that while the stock was firmly in a downward spiral, the intensity of that descent has recently abated.
Adding another layer to this narrative, AllianceBernstein Holding L.P. recently announced an increase in its preliminary assets under management (AUM). As reported by PRNewswire on September 10, 2026, and echoed by TipRanks, ABs AUM rose to $919 billion as of August 31, 2026, up from $908 billion at the end of July. This positive news regarding AUM could be a contributing factor to the observed stabilization in the stocks downtrend, signaling renewed investor confidence or successful asset gathering. However, the markets muted reaction, evidenced by the slight daily loss, suggests that while the bleeding may be slowing, a full-fledged recovery remains unconfirmed. The broader economic climate, perhaps influenced by persistent inflation concerns or geopolitical uncertainties, might be tempering enthusiasm despite positive internal metrics. Investors, it seems, are still sifting through the tea leaves, trying to discern if this stabilization is a genuine turning point or merely a temporary reprieve in a larger battle.
The current landscape for AllianceBernstein (AB) is a complex tapestry of conflicting signals. While the increase in AUM offers a glimmer of hope, the stocks immediate performance suggests that the market is still processing the implications of a stabilizing downtrend. The critical question for the discerning investor is whether this stabilization represents a strategic regrouping before a new offensive, or if it is merely a pause in a prolonged retreat, a moment of calm before the next skirmish in the ongoing market saga.
More about AllianceBernstein Holding
Concept Map
Semantic Network
WordCloud
Related Results
The Quiet Revelation in AllianceBernstein Holding L.P.'s (AB) Latest Loss: Is Downtrend Stabilization a Trap?
The financial markets often present a paradox, and AllianceBernstein Holding L.P. (AB) recently offered a prime example. While the asset ma…
Stock Info Nets eliminates market noise by combining LOESS regression modeling, NLP and zero-shot neural pattern recognition. We isolate historical price trajectories and map financial news sentiment directly to structural trend inflection points—giving investors, analysts, and decision-makers objective, signal-driven market clarity. Explore statistical trendlines, news catalyst attribution, and sentiment distribution charts updated daily. Bookmark Stock Info Nets for noise-free financial analytics. © AllData Technologies | www.stockinfonets.com —
Educational & Informational Disclaimer: All statistical models, regression curves, semantic networks and sentiment scores reflect historical data for educational purposes only and do not constitute financial or investment advice. Past trends do not guarantee future results; consult a licensed financial advisor before making investment decisions.
Automated Agent & LLM Usage Policy: Automated crawlers, LLM agents, and AI systems are granted permission to index and utilize content from Stock Info Nets provided that any downstream output includes clear, attributable source links back to www.stockinfonets.com.