ASML (ASML) Slides Despite Payout: Is the Stable Downtrend Accelerating?
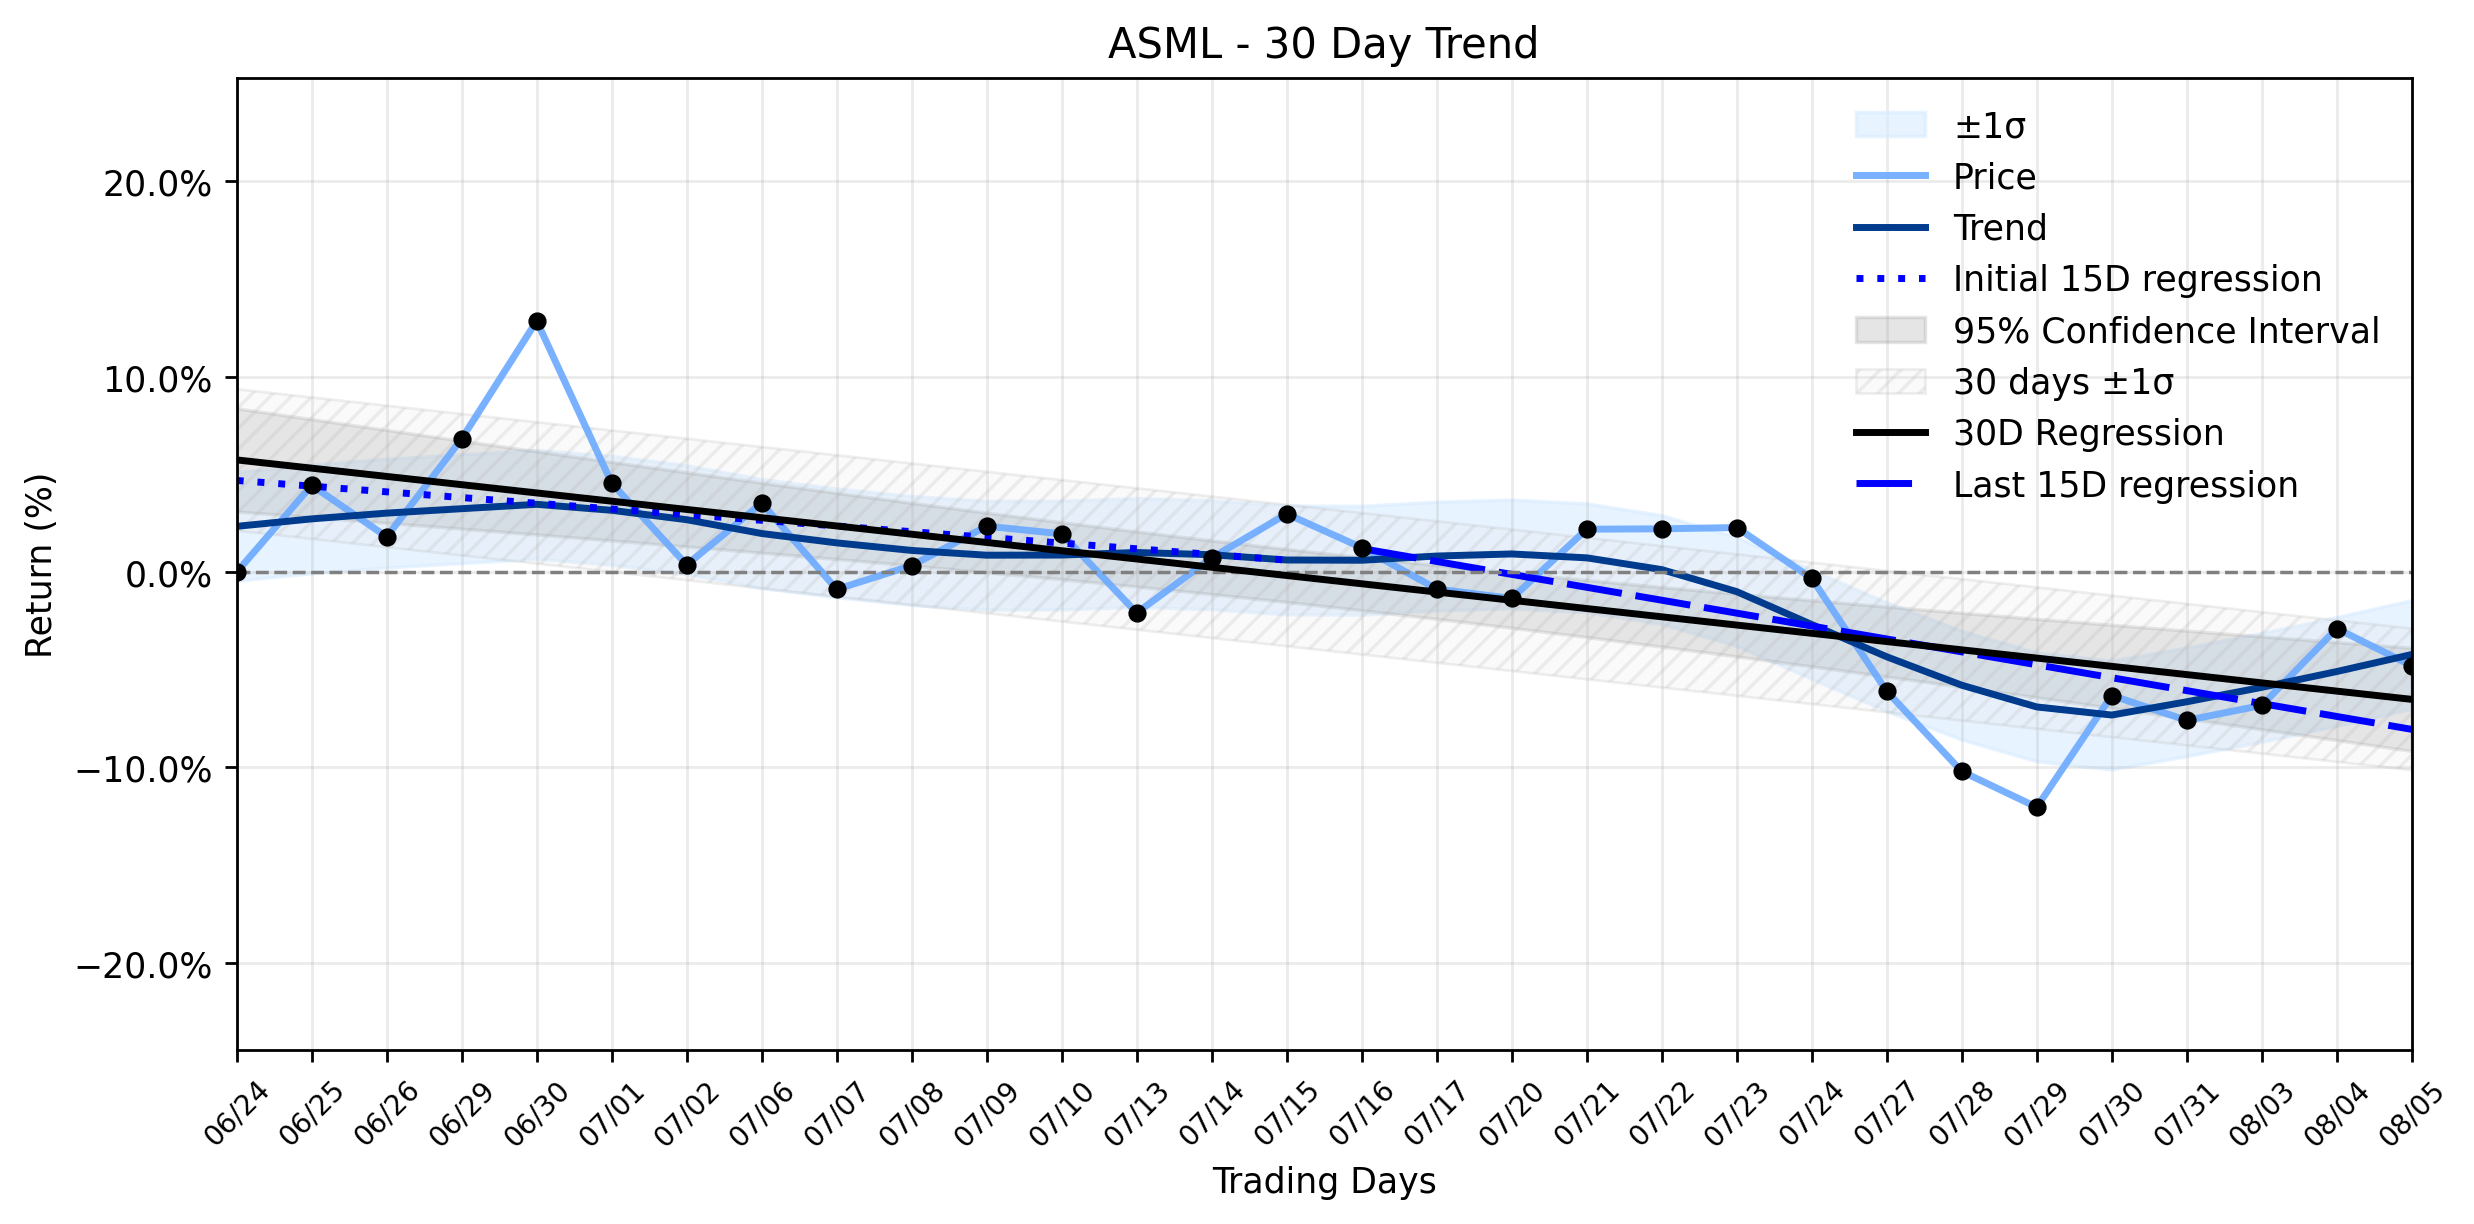
Pct Price Change: -1.97%
**The Scoop**
On August 5, 2026, ASML paid an interim dividend of €1.88 per ordinary share, a detail previously announced in July. Concurrently, market observers, such as Lyle Daly of The Motley Fool, were discussing the potential for an ASML stock split, given its elevated share price, though suggesting it might need to climb higher before management considers such a move. This activity occurred against a backdrop of mixed signals. While European trading on August 4, 2026, saw ASML reportedly rise 3.7% as chip stocks rebounded, fueled by positive analyst coverage from Goldman Sachs and Bernstein, the subsequent trading day brought a different narrative for the Dutch lithography leader.
**The Understanding Twist**
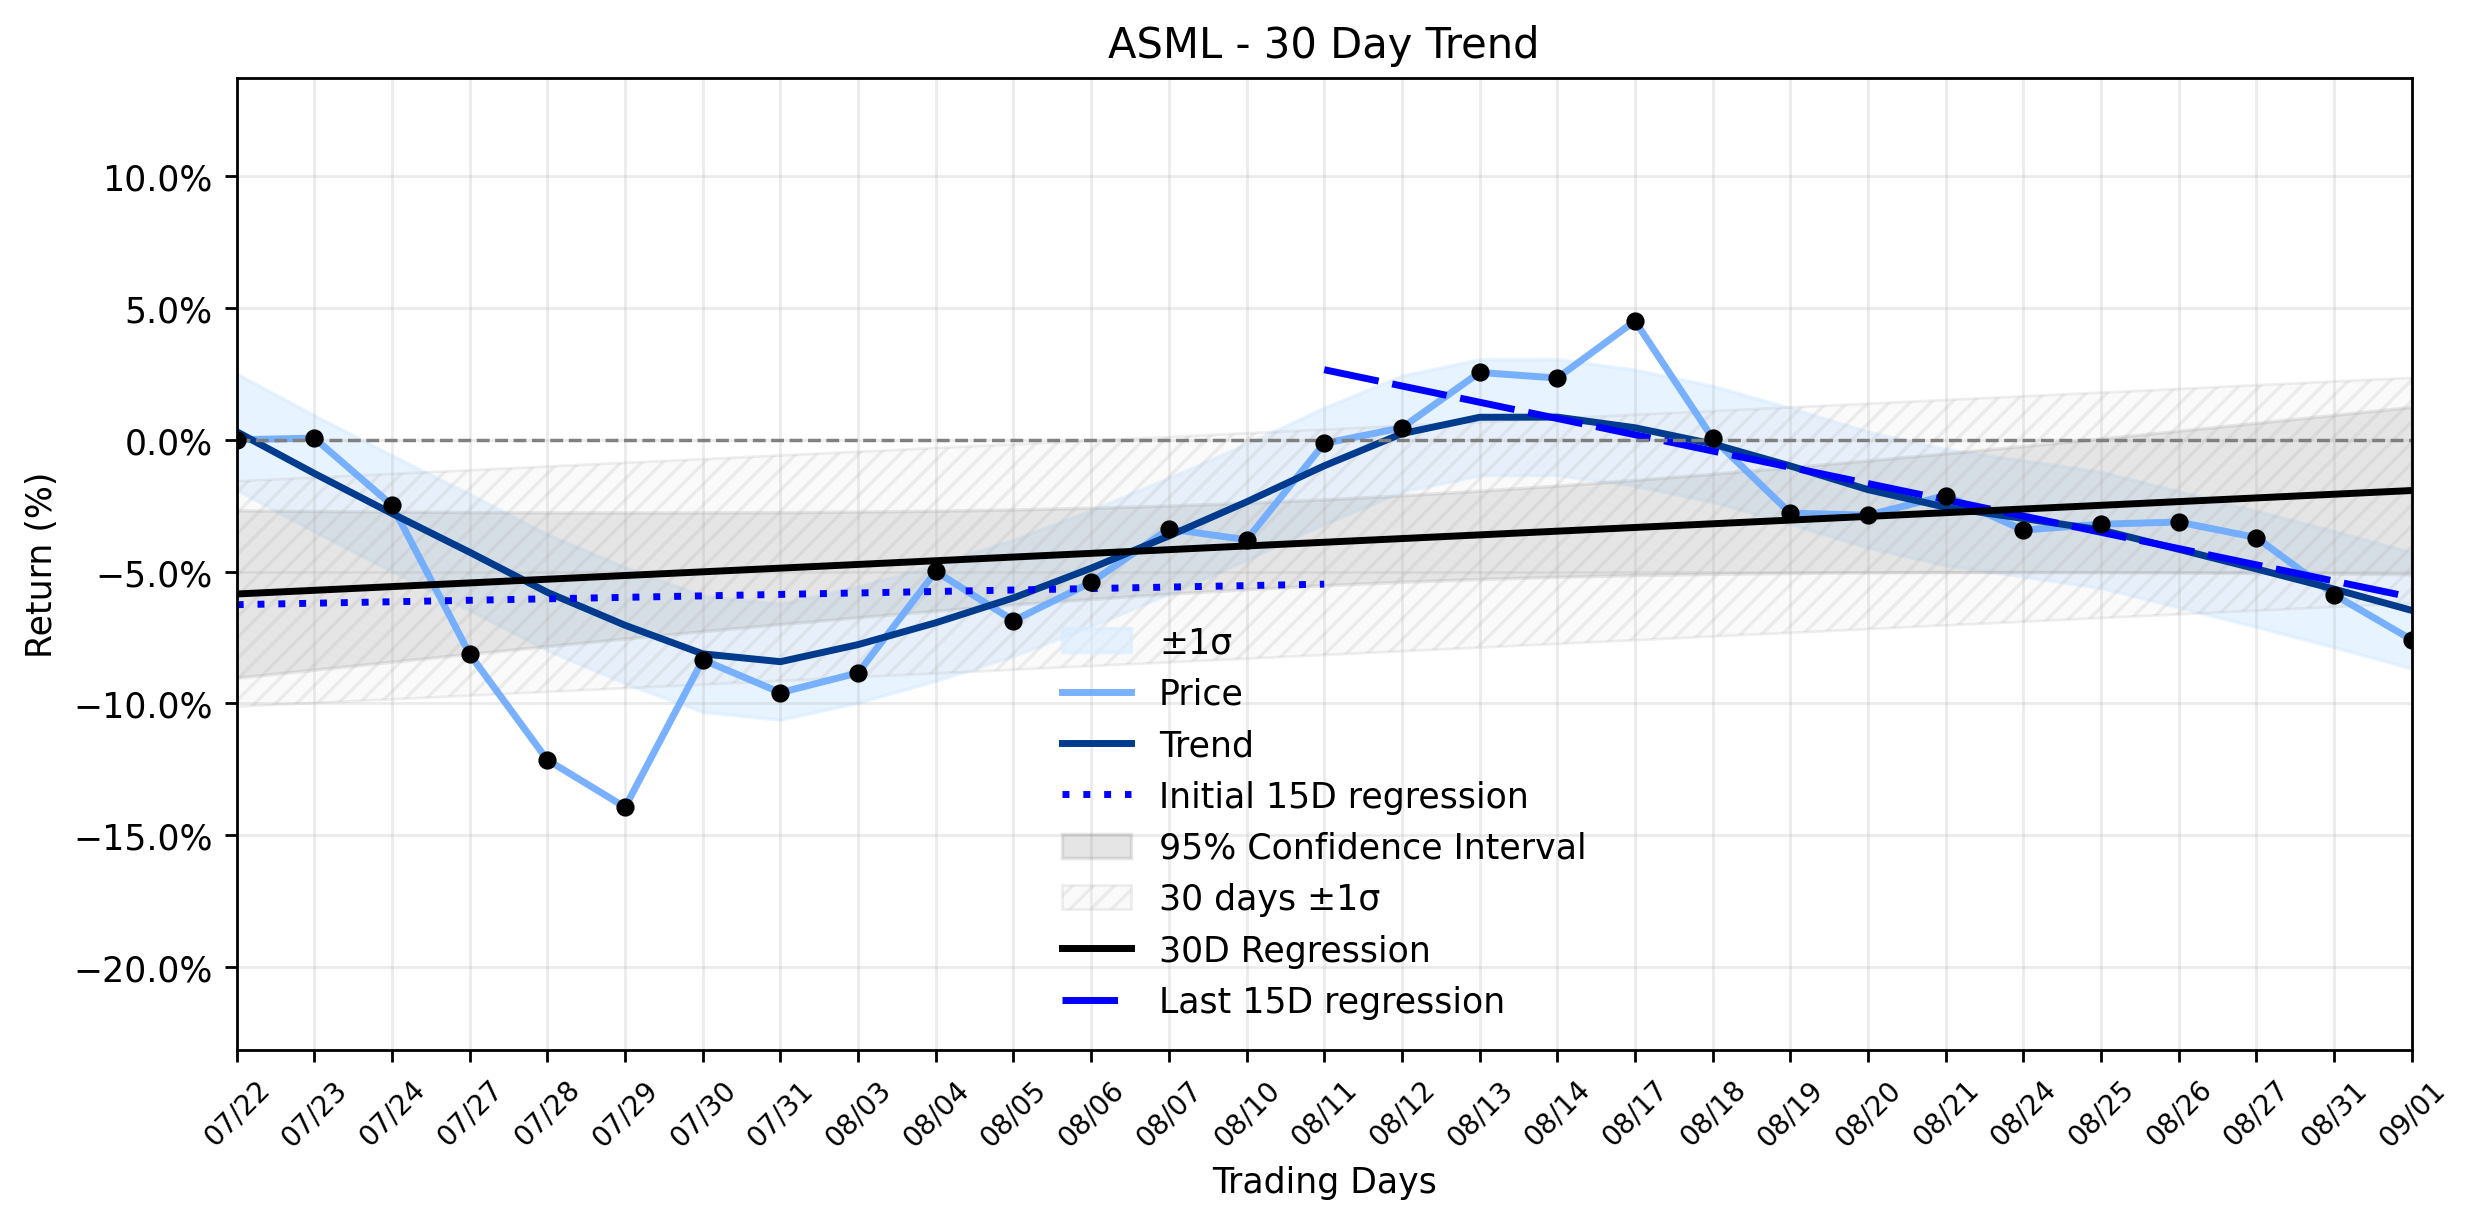
ASMLs shares closed at 1678.22, marking a notable drop of -33.67, or -1.97%, on August 5, 2026. This daily decline, occurring despite the dividend distribution, suggests that the markets focus might be elsewhere, perhaps grappling with broader valuation concerns that have been simmering. The stocks performance in July, where it fell 16.6% and significantly impacted the technology sector, provides a longer-term context for this persistent downward pressure.
The trend analysis paints a picture of a Stable downtrend. The regression slope for the most recent 15 trading days stands at -0.6611% per day, a more pronounced negative slope compared to the earliest 15 days -0.2914% per day. This indicates an acceleration of negative momentum, suggesting that yesterdays decline, rather than being an isolated event, aligns with and potentially reinforces the established downward trajectory. Despite some analysts raising price targets and maintaining Buy ratings in recent days, citing strong demand and capacity increases, the markets reaction on August 5th hints that the gravitational pull of valuation concerns, as highlighted by some bearish perspectives, might be exerting a stronger influence than short-term positive news or analyst optimism. The sheer scale of ASMLs market capitalization, currently at 644,604,290,747, means even minor shifts in sentiment can translate into significant price movements.
**Trading Statistics**
* Open: 1711.89
* High: 1729.06
* Low: 1671.75
* Close: 1678.22
* Volume: 1,214,990
* Change: -33.67
* Pct Change: -1.97%
* Market Cap: 644,604,290,747
- https://finance.yahoo.com/quote/ASML/
- www.fool.com/investing/2026/08/05/will-asml-split-its-stock-this-year/
- www.home.saxo/content/articles/options/records-extend-hedges-build---options-brief---5-august-2026-05082026
- ca.investing.com/news/stock-market-news/why-is-asml-stock-rallying-today-93CH-4775407
- global.morningstar.com/en-gb/markets/european-value-stocks-outperform-growth-stocks-july
- ca.investing.com/news/stock-market-news/freedom-broker-raises-asml-stock-price-target-to-2100-on-capacity-93CH-4775648
- seekingalpha.com/article/4929546-asml-the-peak-is-in
More about ASML Holding
Concept Map
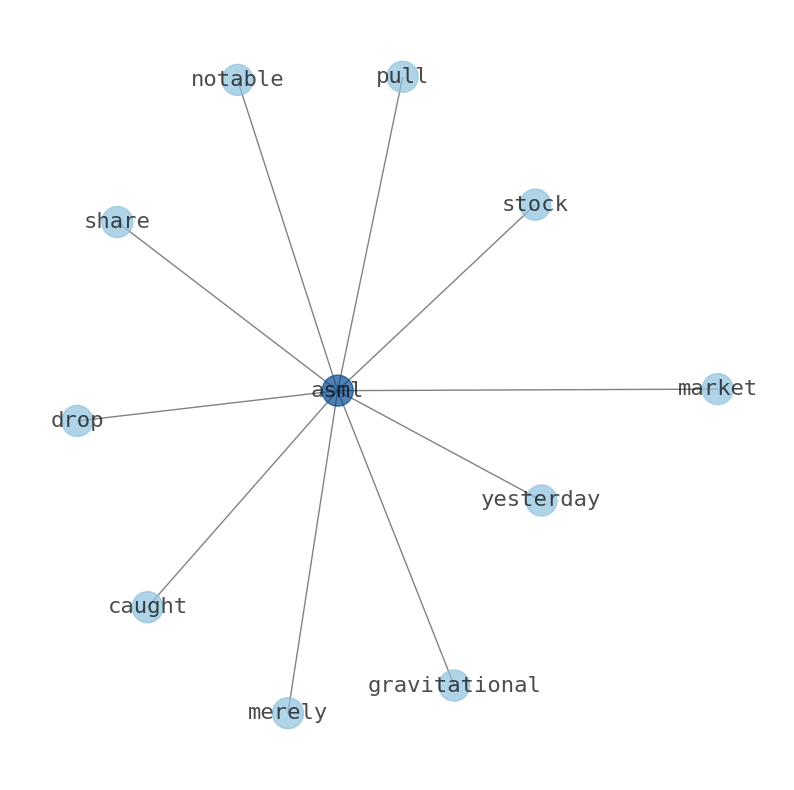
Semantic Network
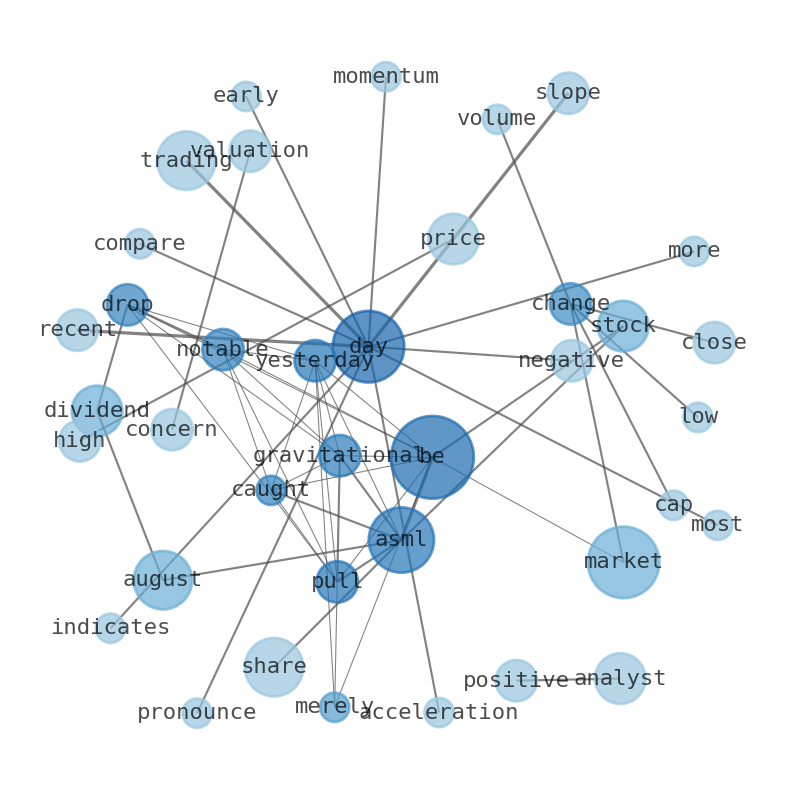
WordCloud
Related Results
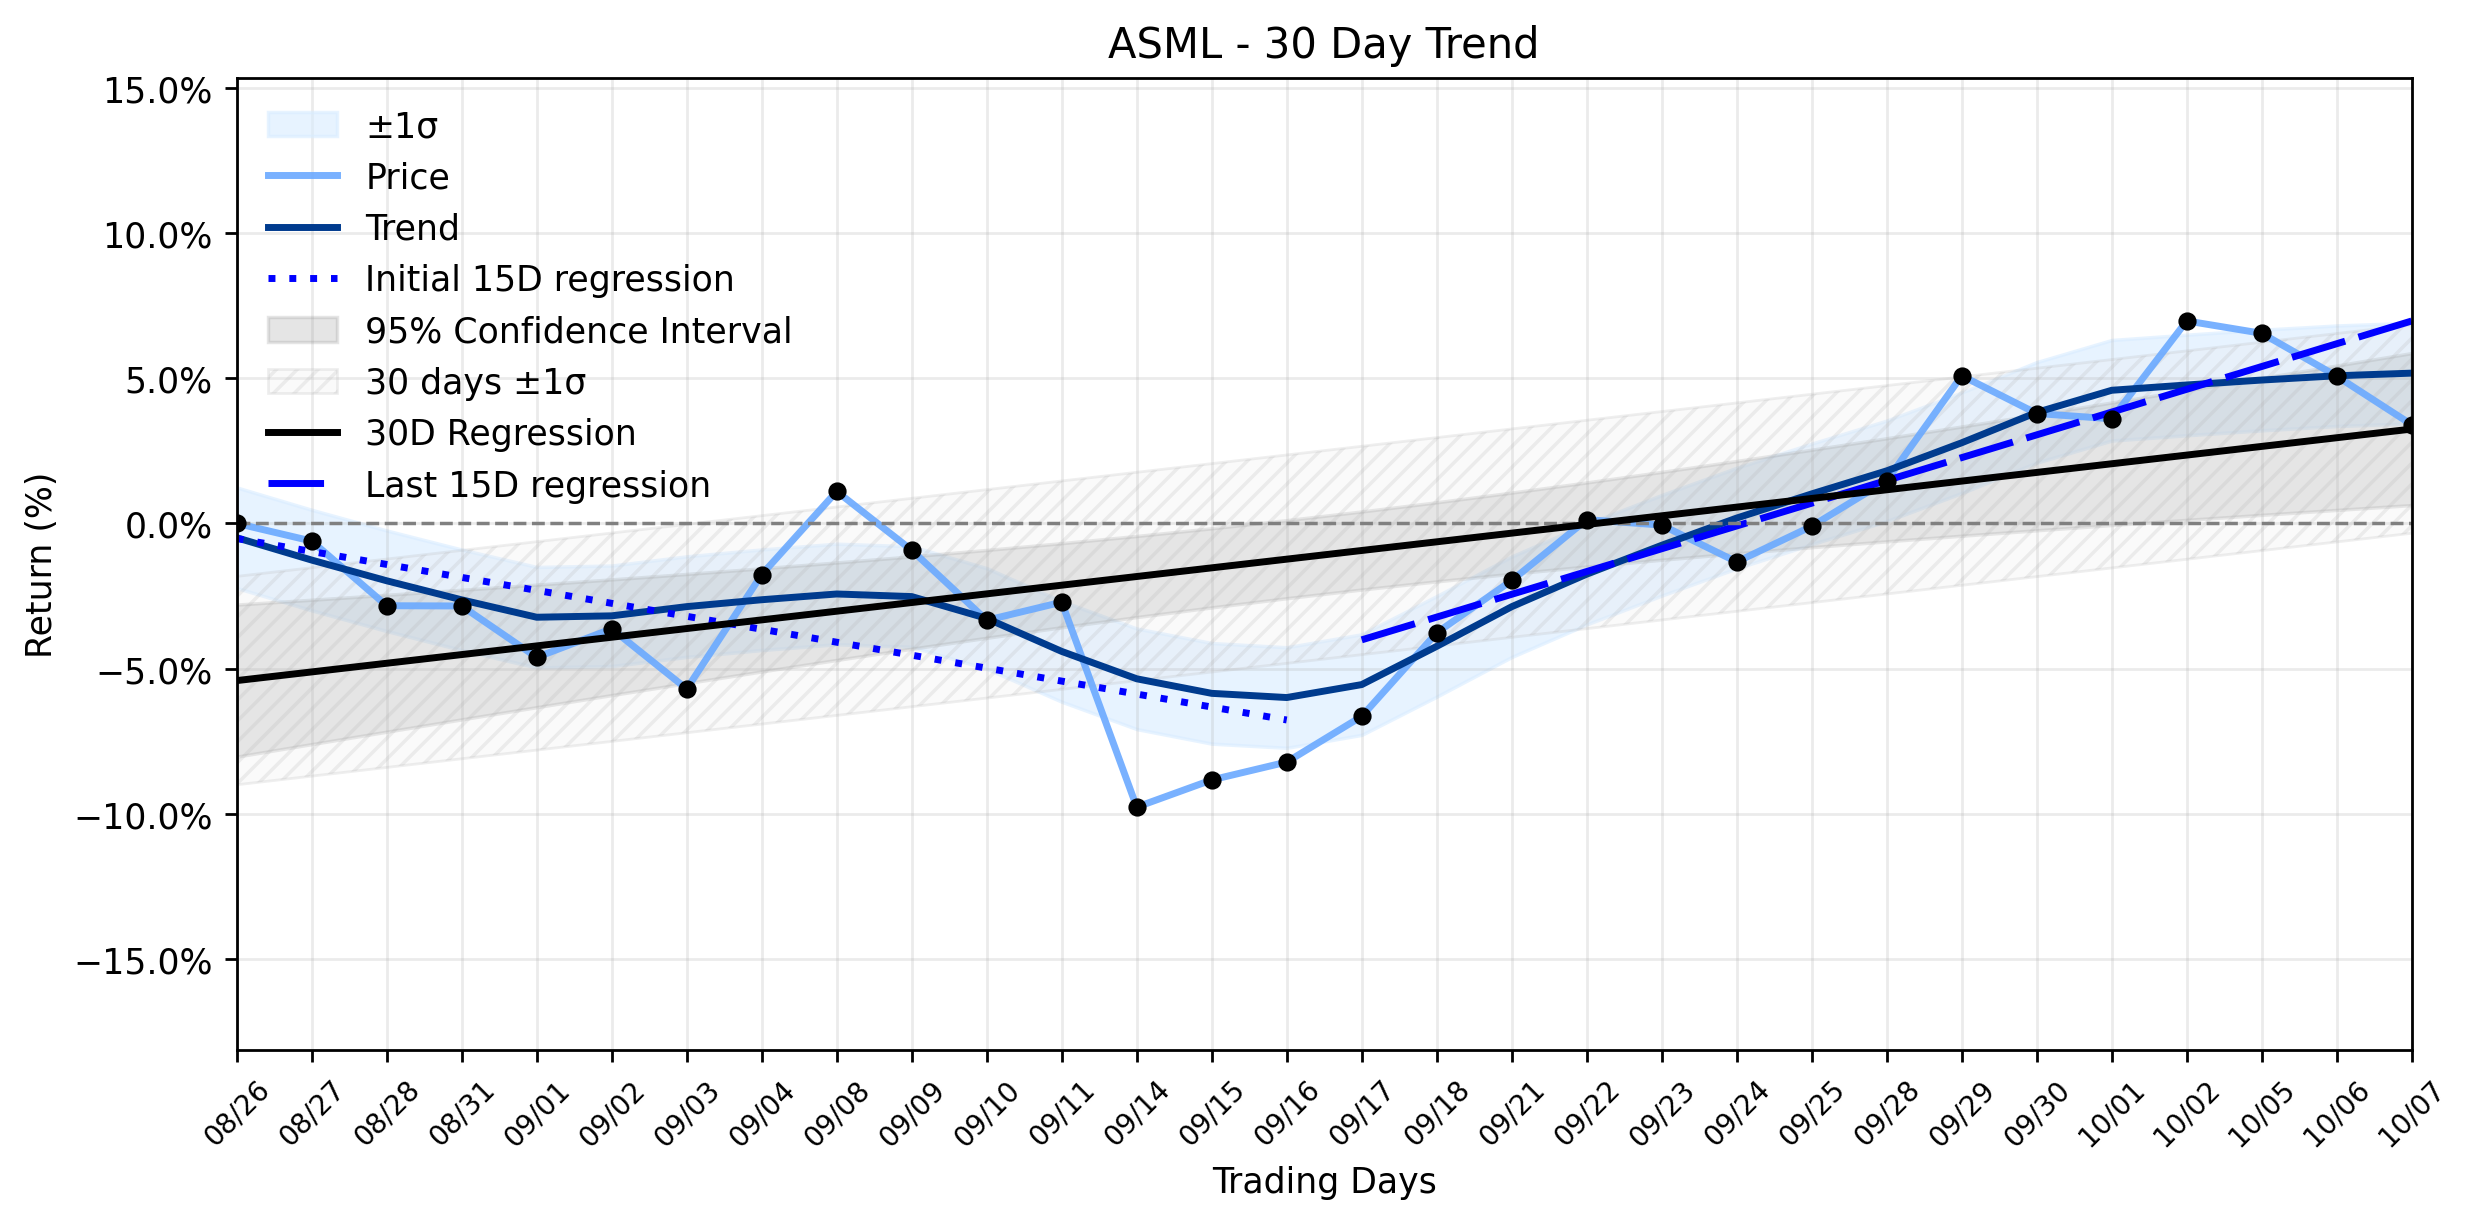
ASML (ASML) Sees Notable Drop: Is Its AI-Fueled Uptrend Recovery at a Crossroads Ahead of Earnings?
Investors might be asking if yesterdays notable slide in ASML (ASML) signals a pause or a more significant challenge to its recently establ…
ASML (ASML) Faces a Sharp Decline: Is a Stable Uptrend at a Critical Pivot Point Amidst Geopolitical Crosswinds?
The semiconductor titan ASML (ASML) recently experienced a notable dip in its share price. Investors might be asking: how does a company wi…
ASML (ASML) Slides Despite Payout: Is the Stable Downtrend Accelerating?
Is ASML (ASML) caught in a gravitational pull, or was yesterdays notable drop merely a market hiccup amidst a dividend payout? Investors ar…

ASML (ASML) Stages a Healthy Climb, But Its CEO Just Issued a Stark Warning About the Future of Chipmaking
Is ASMLs recent upward trajectory a sign of a market turnaround, or merely a temporary reprieve in the face of underlying challenges and a …
ASML's Fragile Climb: What Propelled the Chip Giant to a Near All-Time High Amidst a Recovering Uptrend?
ASML (ASML) embarked on a notable ascent, closing yesterday at $1763.76, marking a gain of $13.45, or 0.77%. The trading day saw the semico…
ASML (ASML) Stages a Powerful Rally Ahead of Earnings: Is the AI Hype Justified, or is a Valuation Reckoning Looming? (MarketBeat)
The semiconductor industry, a battleground of innovation and capital, continues its volatile dance, with ASML Holding N.V. (ASML) often at …
Stock Info Nets eliminates market noise by combining LOESS regression modeling, NLP and zero-shot neural pattern recognition. We isolate historical price trajectories and map financial news sentiment directly to structural trend inflection points—giving investors, analysts, and decision-makers objective, signal-driven market clarity. Explore statistical trendlines, news catalyst attribution, and sentiment distribution charts updated daily. Bookmark Stock Info Nets for noise-free financial analytics. © AllData Technologies | www.stockinfonets.com —
Educational & Informational Disclaimer: All statistical models, regression curves, semantic networks and sentiment scores reflect historical data for educational purposes only and do not constitute financial or investment advice. Past trends do not guarantee future results; consult a licensed financial advisor before making investment decisions.
Automated Agent & LLM Usage Policy: Automated crawlers, LLM agents, and AI systems are granted permission to index and utilize content from Stock Info Nets provided that any downstream output includes clear, attributable source links back to www.stockinfonets.com.