ABM Industries (ABM) Takes a Dip: Is Smart Money Signaling a Pause in the Stable Uptrend?
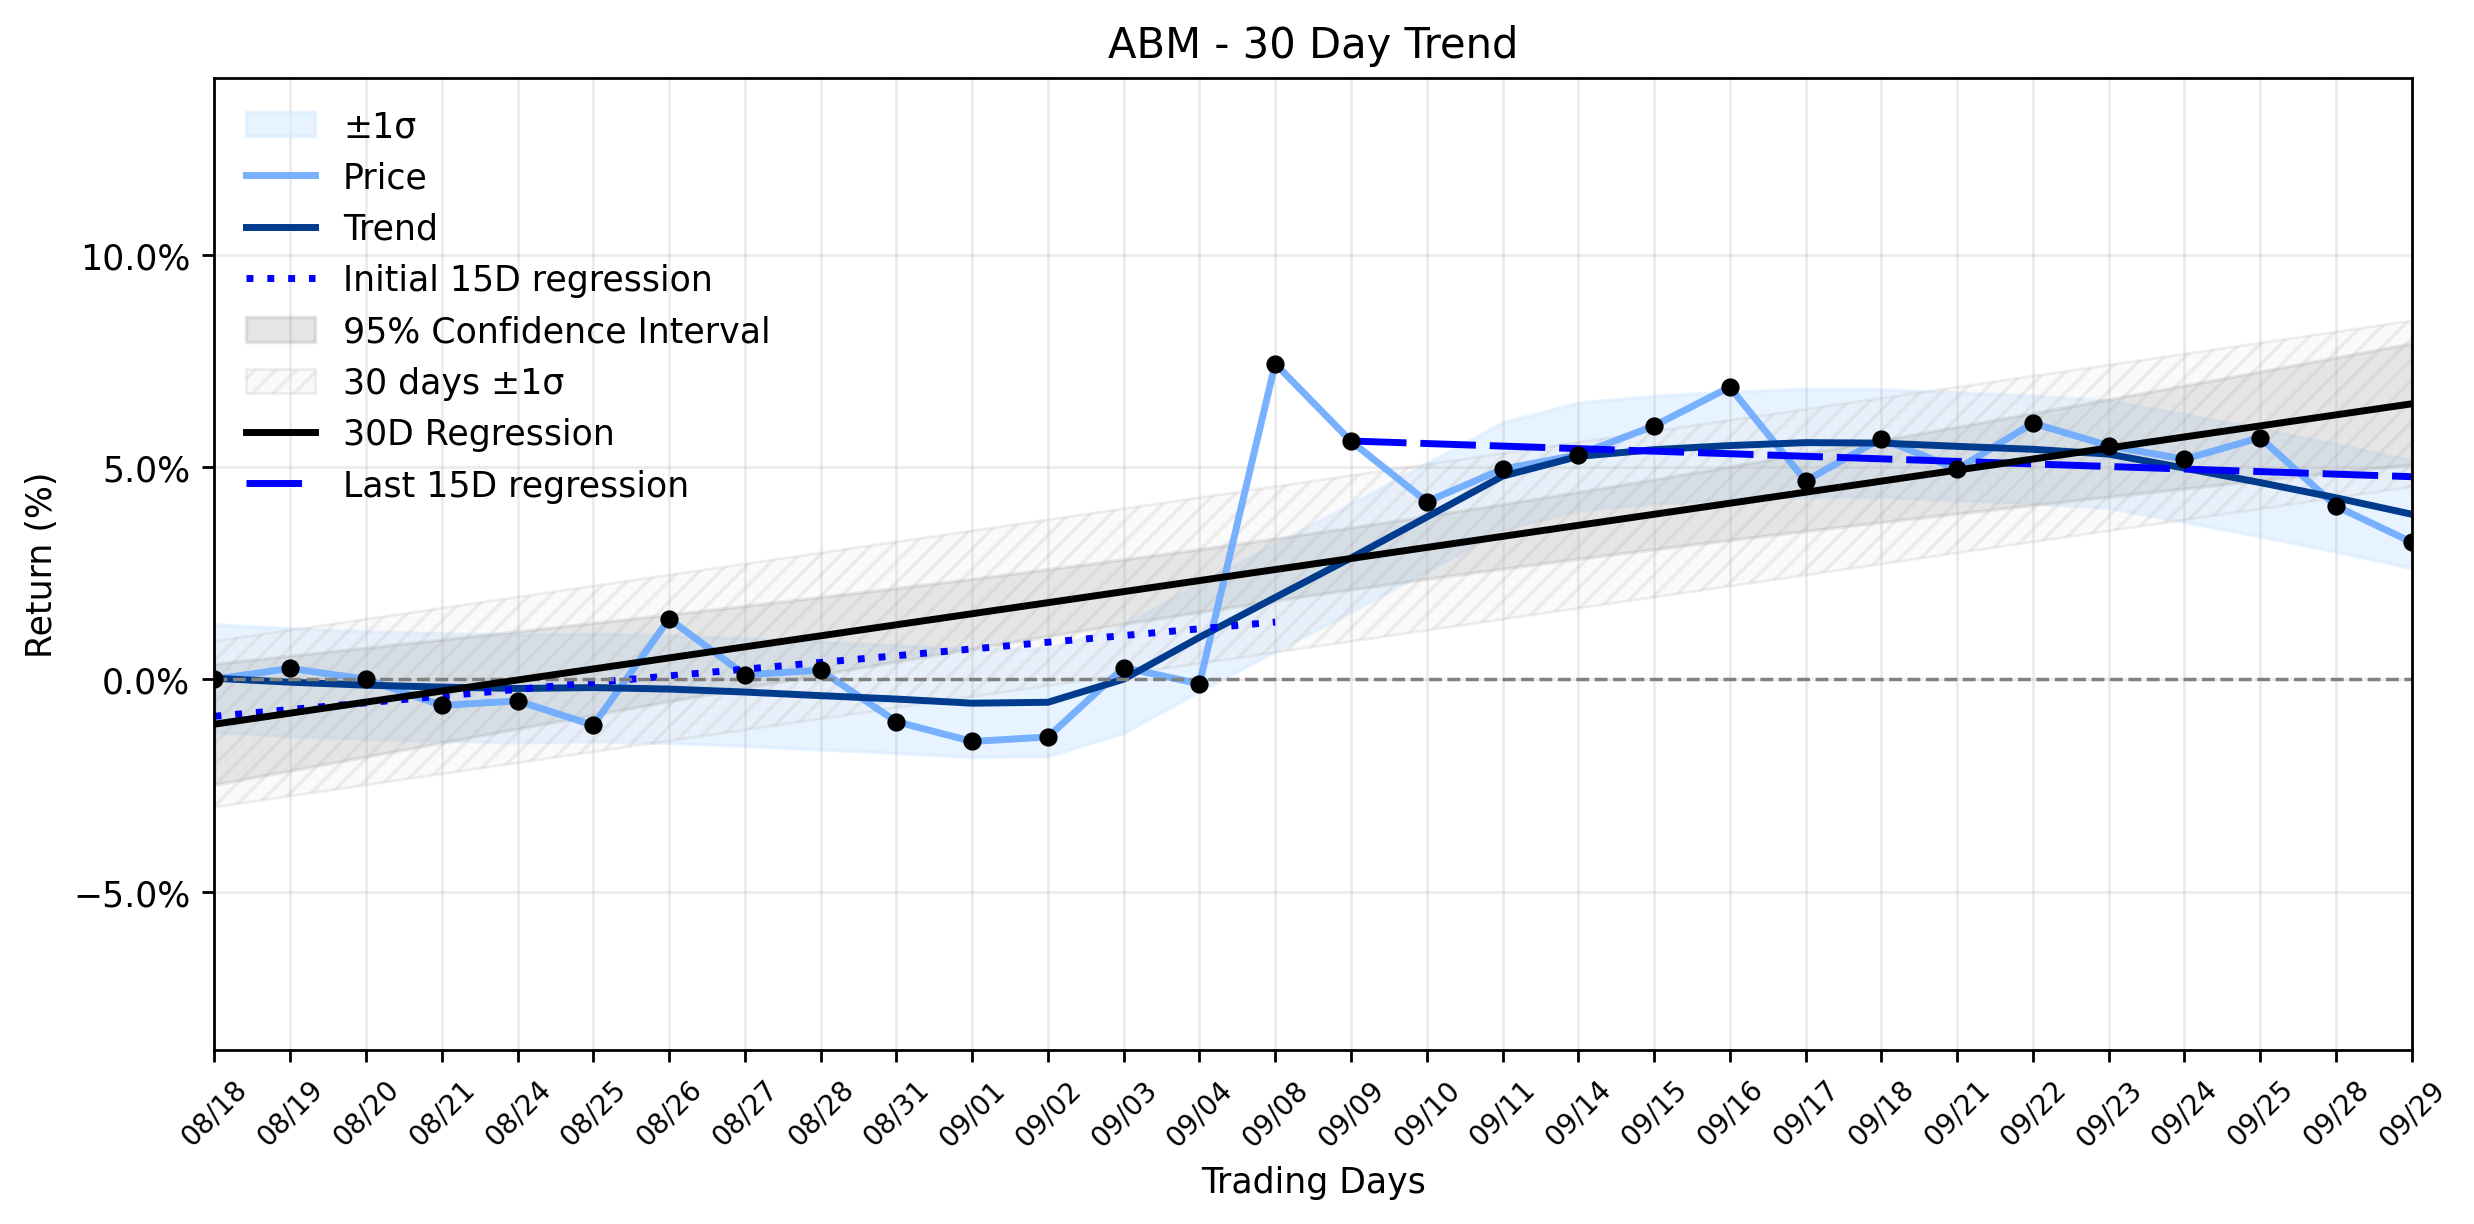
Pct Price Change: -0.82%
Yesterdays trading saw ABM open at $49.02, reach a high of $49.28, and touch a low of $48.55 before closing at $48.62. The stock shed $0.40, marking a -0.82% decrease, with a market capitalization standing at $2,849,841,400. This daily performance contrasts with the broader momentum, where the stock has exhibited a stable uptrend over the past month. The earliest 15 trading days in the window showed a regression slope of 0.1584% per day, while the entire 30-day window maintained a slope of 0.2602% per day. Interestingly, the most recent 15 trading days saw a slight deceleration, with a regression slope of -0.0601% per day, though the delta classification remains insufficient data to declare a significant shift.
The days minor decline occurred despite some seemingly positive corporate news. ABM highlighted its longstanding partnership with the Arizona Cardinals at State Farm Stadium, emphasizing the role of over 200 professionals in maintaining the 1.7-million-square-foot venue. Such announcements typically bolster investor confidence, yet the stock moved lower. This divergence suggests that broader market sentiment or technical factors might have held more sway. Indeed, Stock Traders Daily noted a Full Alignment in Neutral Sentiment for ABM Industries on September 29, 2026, favoring a Wait-and-See Approach and even identifying an Exceptional 28.3:1 risk-reward short setup. This technical outlook, hinting at potential downside, could have contributed to the days cautious trading, overriding the positive PR. Analysts, while having recently raised price targets following ABMs Q3 EPS beat and raised fiscal 2026 guidance, largely maintain Neutral/Hold ratings, suggesting a tempered enthusiasm despite solid fundamentals.
As the market continues its relentless churn, ABM finds itself at a crossroads where a stable uptrend encounters short-term technical headwinds. The dip could be a momentary pause for breath, a tactical retreat by some players, or a reflection of the neutral sentiment that Stock Traders Daily observed. Investors will be watching to see if the underlying stable uptrend reasserts itself, or if this minor dip signals a more protracted period of consolidation, as the battle between fundamental strength and technical pressures plays out on the trading floor.
- https://finance.yahoo.com/quote/ABM/
- investor.abm.com/
- www.globenewswire.com/news-release/2026/09/29/3370756/799/en/abm-and-arizona-cardinals-highlight-partnership-at-state-farm-stadium.html
- investor.abm.com/investor-relations
- www.stocktitan.net/news/ABM/
- news.stocktradersdaily.com/news_release/78/Trading_Systems_Reacting_to_ABM_Volatility_092926042201_1790670121.html
- www.perplexity.ai/finance/ABM/analysis
More about ABM Industries
Concept Map
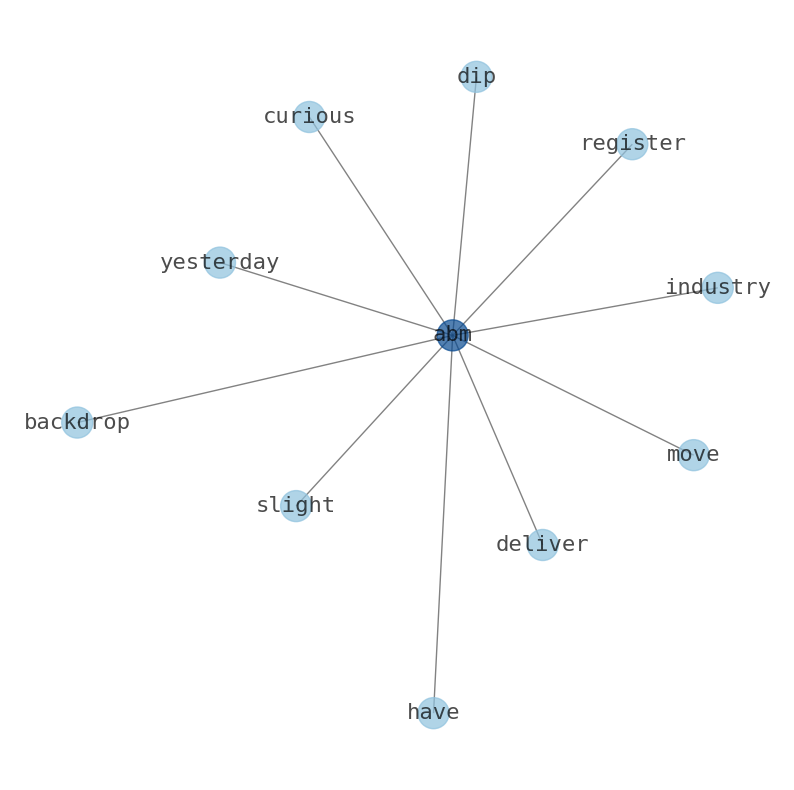
Semantic Network
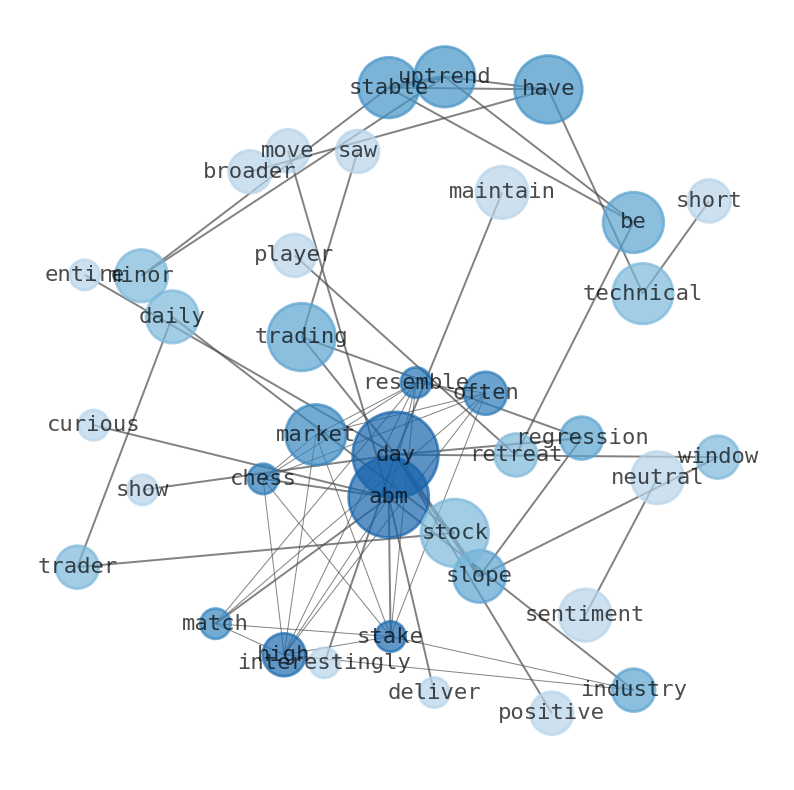
WordCloud
Related Results
ABM Industries (ABM) Takes a Dip: Is Smart Money Signaling a Pause in the Stable Uptrend?
In a market often resembling a high-stakes chess match, ABM Industries (ABM) delivered a curious move yesterday, registering a slight dip a…
Stock Info Nets eliminates market noise by combining LOESS regression modeling, NLP and zero-shot neural pattern recognition. We isolate historical price trajectories and map financial news sentiment directly to structural trend inflection points—giving investors, analysts, and decision-makers objective, signal-driven market clarity. Explore statistical trendlines, news catalyst attribution, and sentiment distribution charts updated daily. Bookmark Stock Info Nets for noise-free financial analytics. © AllData Technologies | www.stockinfonets.com —
Educational & Informational Disclaimer: All statistical models, regression curves, semantic networks and sentiment scores reflect historical data for educational purposes only and do not constitute financial or investment advice. Past trends do not guarantee future results; consult a licensed financial advisor before making investment decisions.
Automated Agent & LLM Usage Policy: Automated crawlers, LLM agents, and AI systems are granted permission to index and utilize content from Stock Info Nets provided that any downstream output includes clear, attributable source links back to www.stockinfonets.com.