Procter & Gamble (PG) Climbs: A Limited Window to Grasp the $10 Billion Paradox?
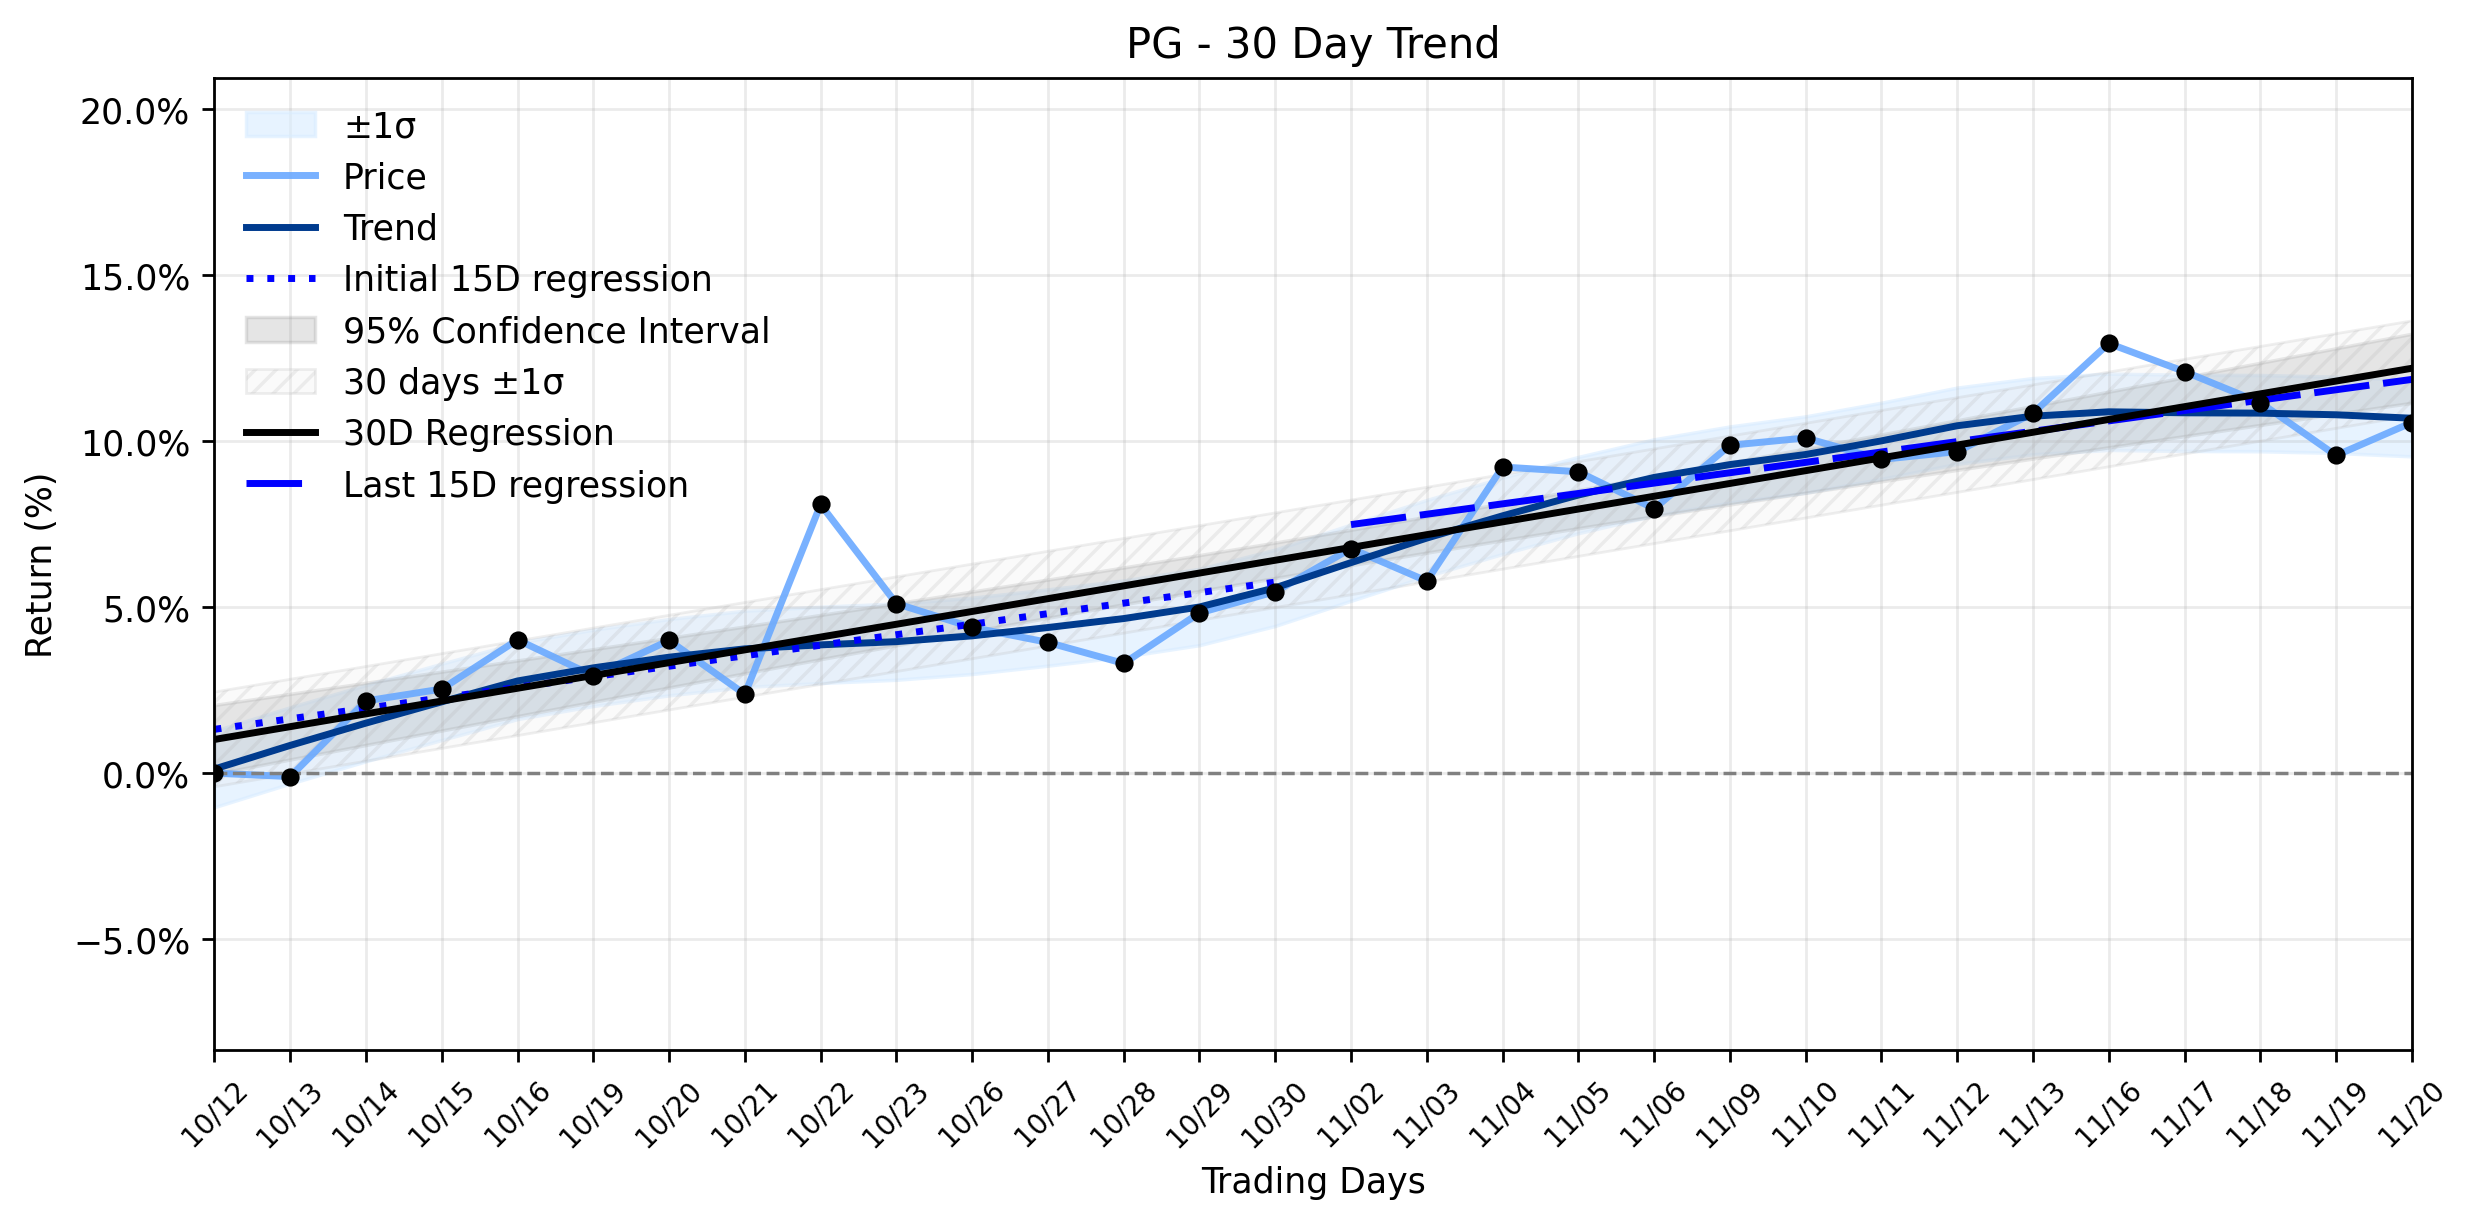
Pct Price Change: 0.91%
Against this backdrop, Procter & Gamble delivered a strategic broadside at its Investor Day on November 19, 2026. The consumer goods behemoth unveiled an ambitious plan to achieve up to $10 billion in productivity savings between fiscal years 2027 and 2030. This colossal effort includes an annual target of up to $1.8 billion from cost of goods sold, largely driven by increased automation and the strategic deployment of artificial intelligence across its supply chain. The human cost of this efficiency drive, however, is a planned reduction of its product supply workforce—encompassing manufacturing and logistics, including contractors—by 20% to 30% by 2030. Chief Financial Officer Andre Schulten emphasized that the primary objective of these savings is not merely to offset rising costs, but to fuel reinvestment into pricing, product innovation, and advertising, thereby accelerating growth beyond market averages. This strategic pivot comes after P&G had previously warned that oil at $113 means more is coming in Q3 and Q4, highlighting the intense cost pressures necessitating such drastic measures. Adding a layer of external validation, Citigroup analyst Filippo Falorni maintained a Buy rating for PG on November 20, 2026, and even nudged the price target higher, from $187.00 to $190.00.
The market’s reaction to this news, initially met with some apprehension, ultimately saw Procter & Gamble (PG) close yesterday, November 20, 2026, at $169.37, marking a gain of 1.52, or 0.91% for the day. This positive movement, despite the significant workforce reduction announcement, suggests investors are weighing the long-term benefits of substantial cost savings and strategic reinvestment against the immediate implications of restructuring. The stock opened at 167.85, hit a high of 171.61, and a low of 169.05, with a volume of 11,952,900 shares traded, culminating in a market capitalization of $392,562,919,612.
From a broader perspective, the daily gain of 0.91% aligns perfectly with the assets underlying momentum. The trend analysis reveals a Stable uptrend, with the earliest 15 trading days showing a regression slope of 0.3165% per day and the most recent 15 trading days exhibiting a slope of 0.3122% per day. The overall 30-day window confirms this upward trajectory with a slope of 0.3853% per day. While the delta classification indicates insufficient data for a meaningful change in the trends acceleration, the consistent positive slopes across all periods, coupled with yesterdays climb, suggest that the market views P&Gs aggressive cost-cutting and reinvestment strategy as a necessary, albeit stark, maneuver to fortify its position in the ongoing economic skirmish. The companys ability to gain ground even amidst news of significant operational overhaul underscores a belief in its strategic foresight and resilience, a testament to its enduring power in the consumer goods arena.
- https://finance.yahoo.com/quote/PG/
- 247wallst.com/investing/2026/11/20/procter-gamble-wants-10-billion-in-savings-and-fewer-factory-workers/
- logos-pres.md/en/news/procter-gamble-intends-to-save-10-billion-over-four-years-by-improving-efficiency/
- www.marketbeat.com/instant-alerts/event-procter-gamble-targets-up-to-10-billion-in-savings-with-ai-and-automation-2026-11-20/
- 247wallst.com/investing/2026/11/20/pg-has-raised-its-dividend-70-years-in-a-row-now-it-plans-to-cut-up-to-30-of-its-manufacturing-and-logistics-workforce-by-2030-as-it-targets-up-to-10-billion-in-savings/
- www.benzinga.com/trading-ideas/movers/26/11/63467356/procter-gamble-plans-up-to-30-supply-job-cuts-by-2030-aims-for-10-billion-in-cost-savings
- stlawyers.ca/blog-news/procter-gamble-job-cuts-november-2026/
- www.metaintro.com/blog/procter-gamble-layoffs-20-to-30-percent-2026
- www.gurufocus.com/news/9213184/pg-maintained-by-citigroup-price-target-raised-to-190
- www.marketbeat.com/instant-alerts/analyst-procter-gamble-nyse-pg-stock-price-expected-to-rise-citigroup-analyst-says-2026-11-20/
More about The Procter & Gamble Company
Concept Map
Semantic Network
WordCloud
Related Results
Procter & Gamble (PG) Climbs: A Limited Window to Grasp the $10 Billion Paradox?
In the ever-churning maelstrom of the consumer defensive sector, where titans like Procter & Gamble (PG) battle the relentless tides of inf…
Procter & Gamble (PG) Surges to New Highs: A Critical Signal for its Enduring Uptrend?
For investors navigating the often-treacherous waters of the market, a critical question arises: can Procter & Gambles (PG) recent surge su…
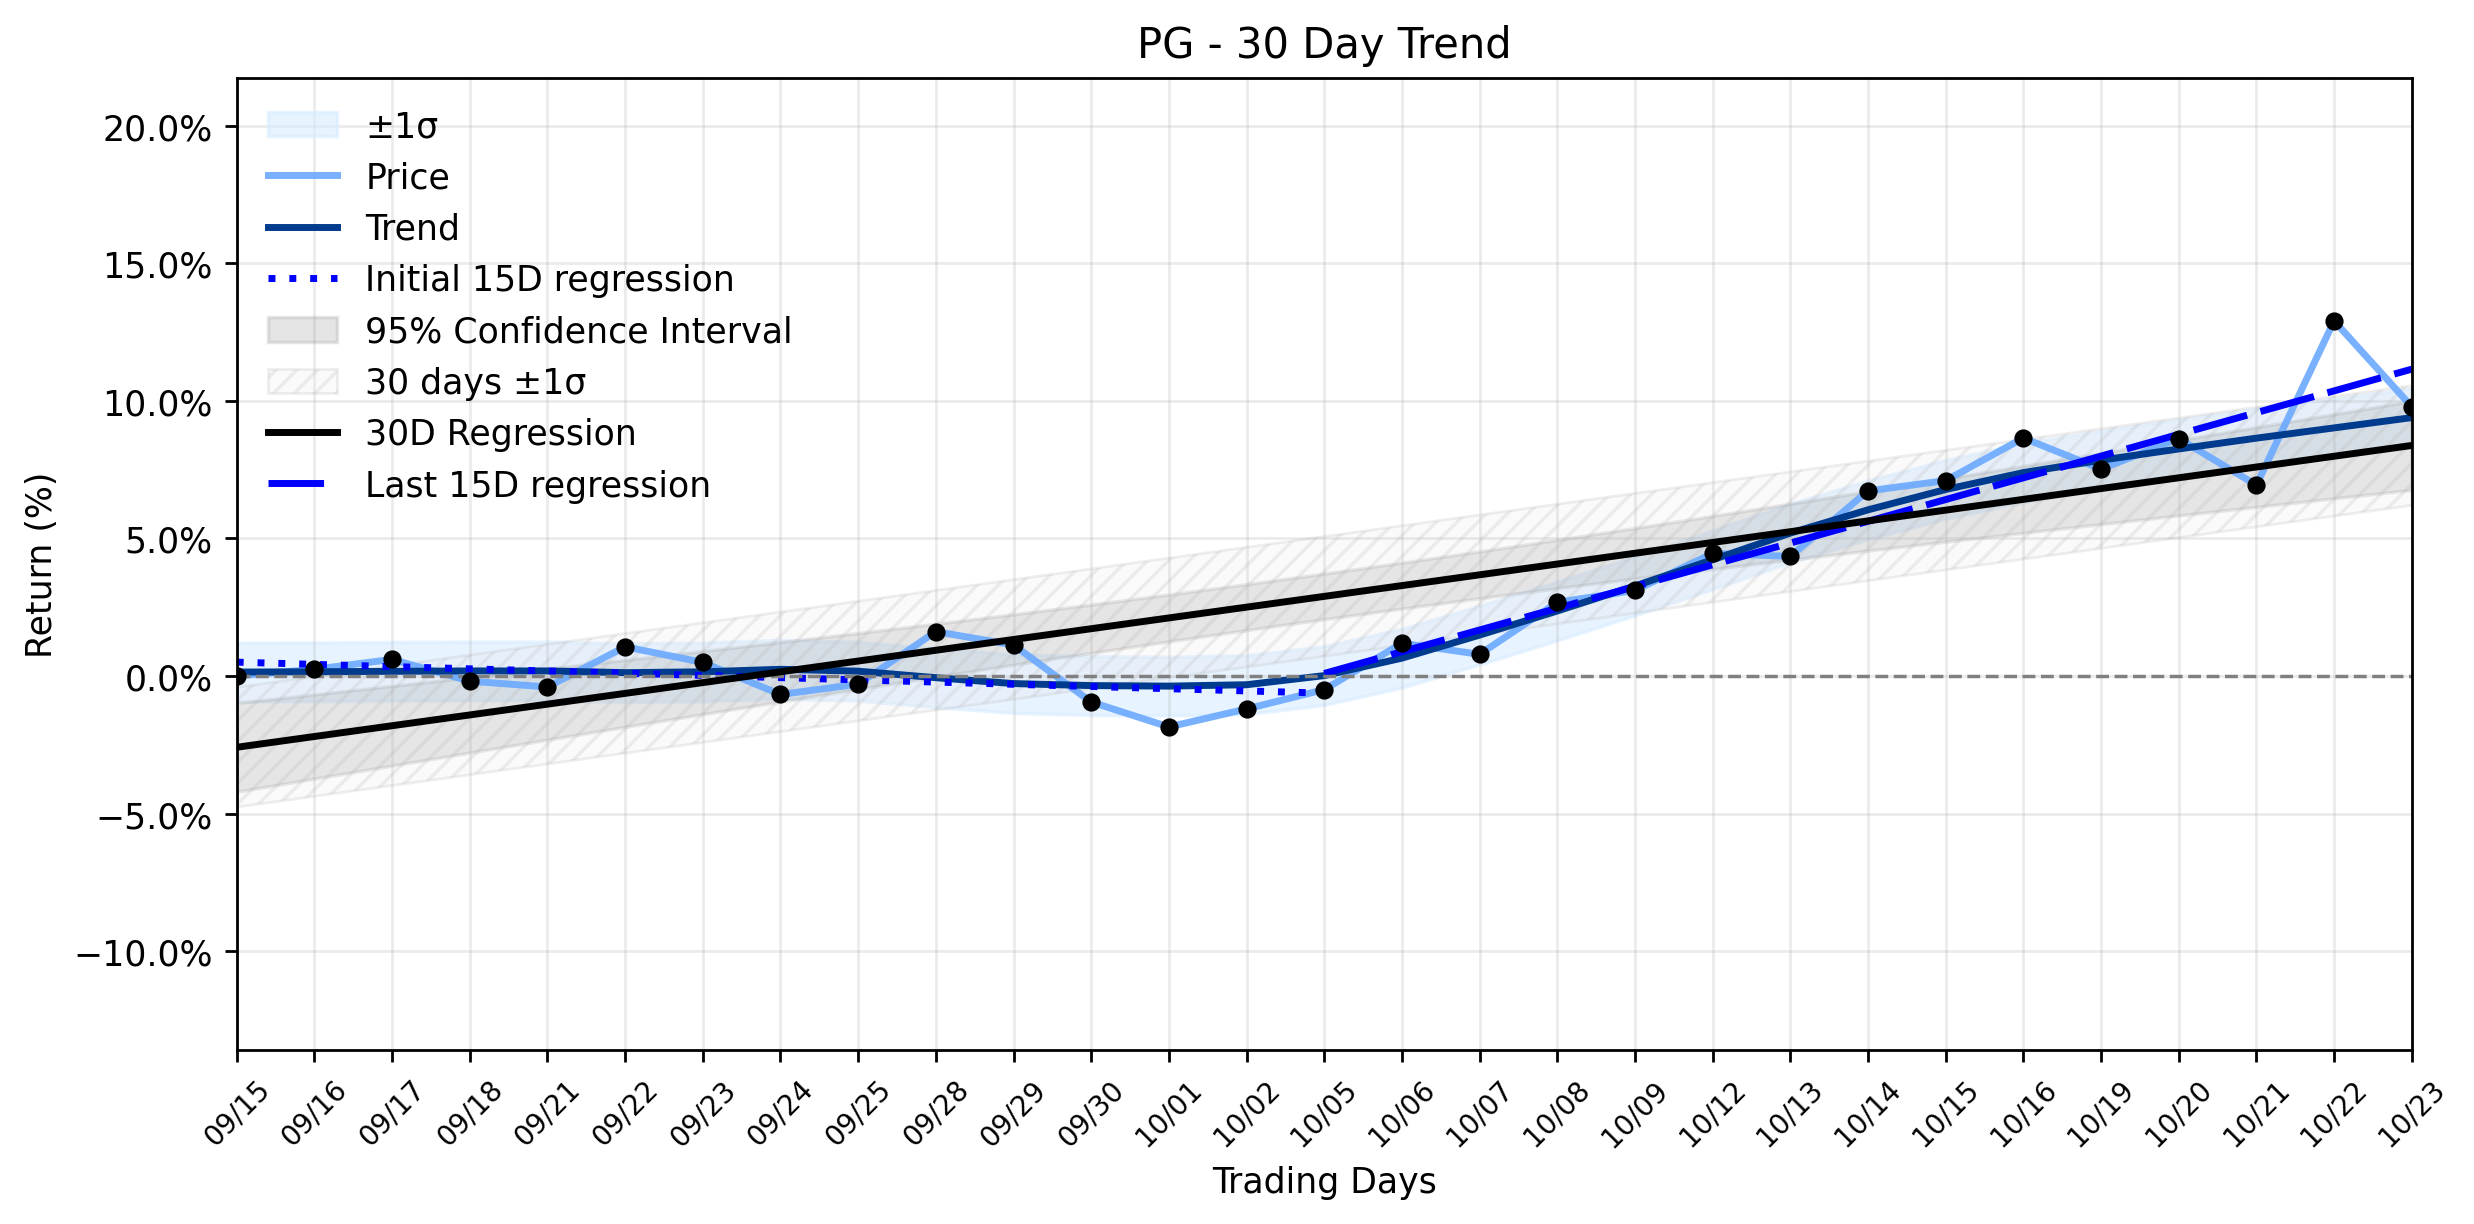
Procter & Gamble (PG) Faces a Significant Retreat: Is This the Opportunity the Uptrend Recovery Needs?
The corporate titans at Procter & Gamble (PG) delivered a compelling performance in their fiscal first quarter of 2027, reporting adjusted …
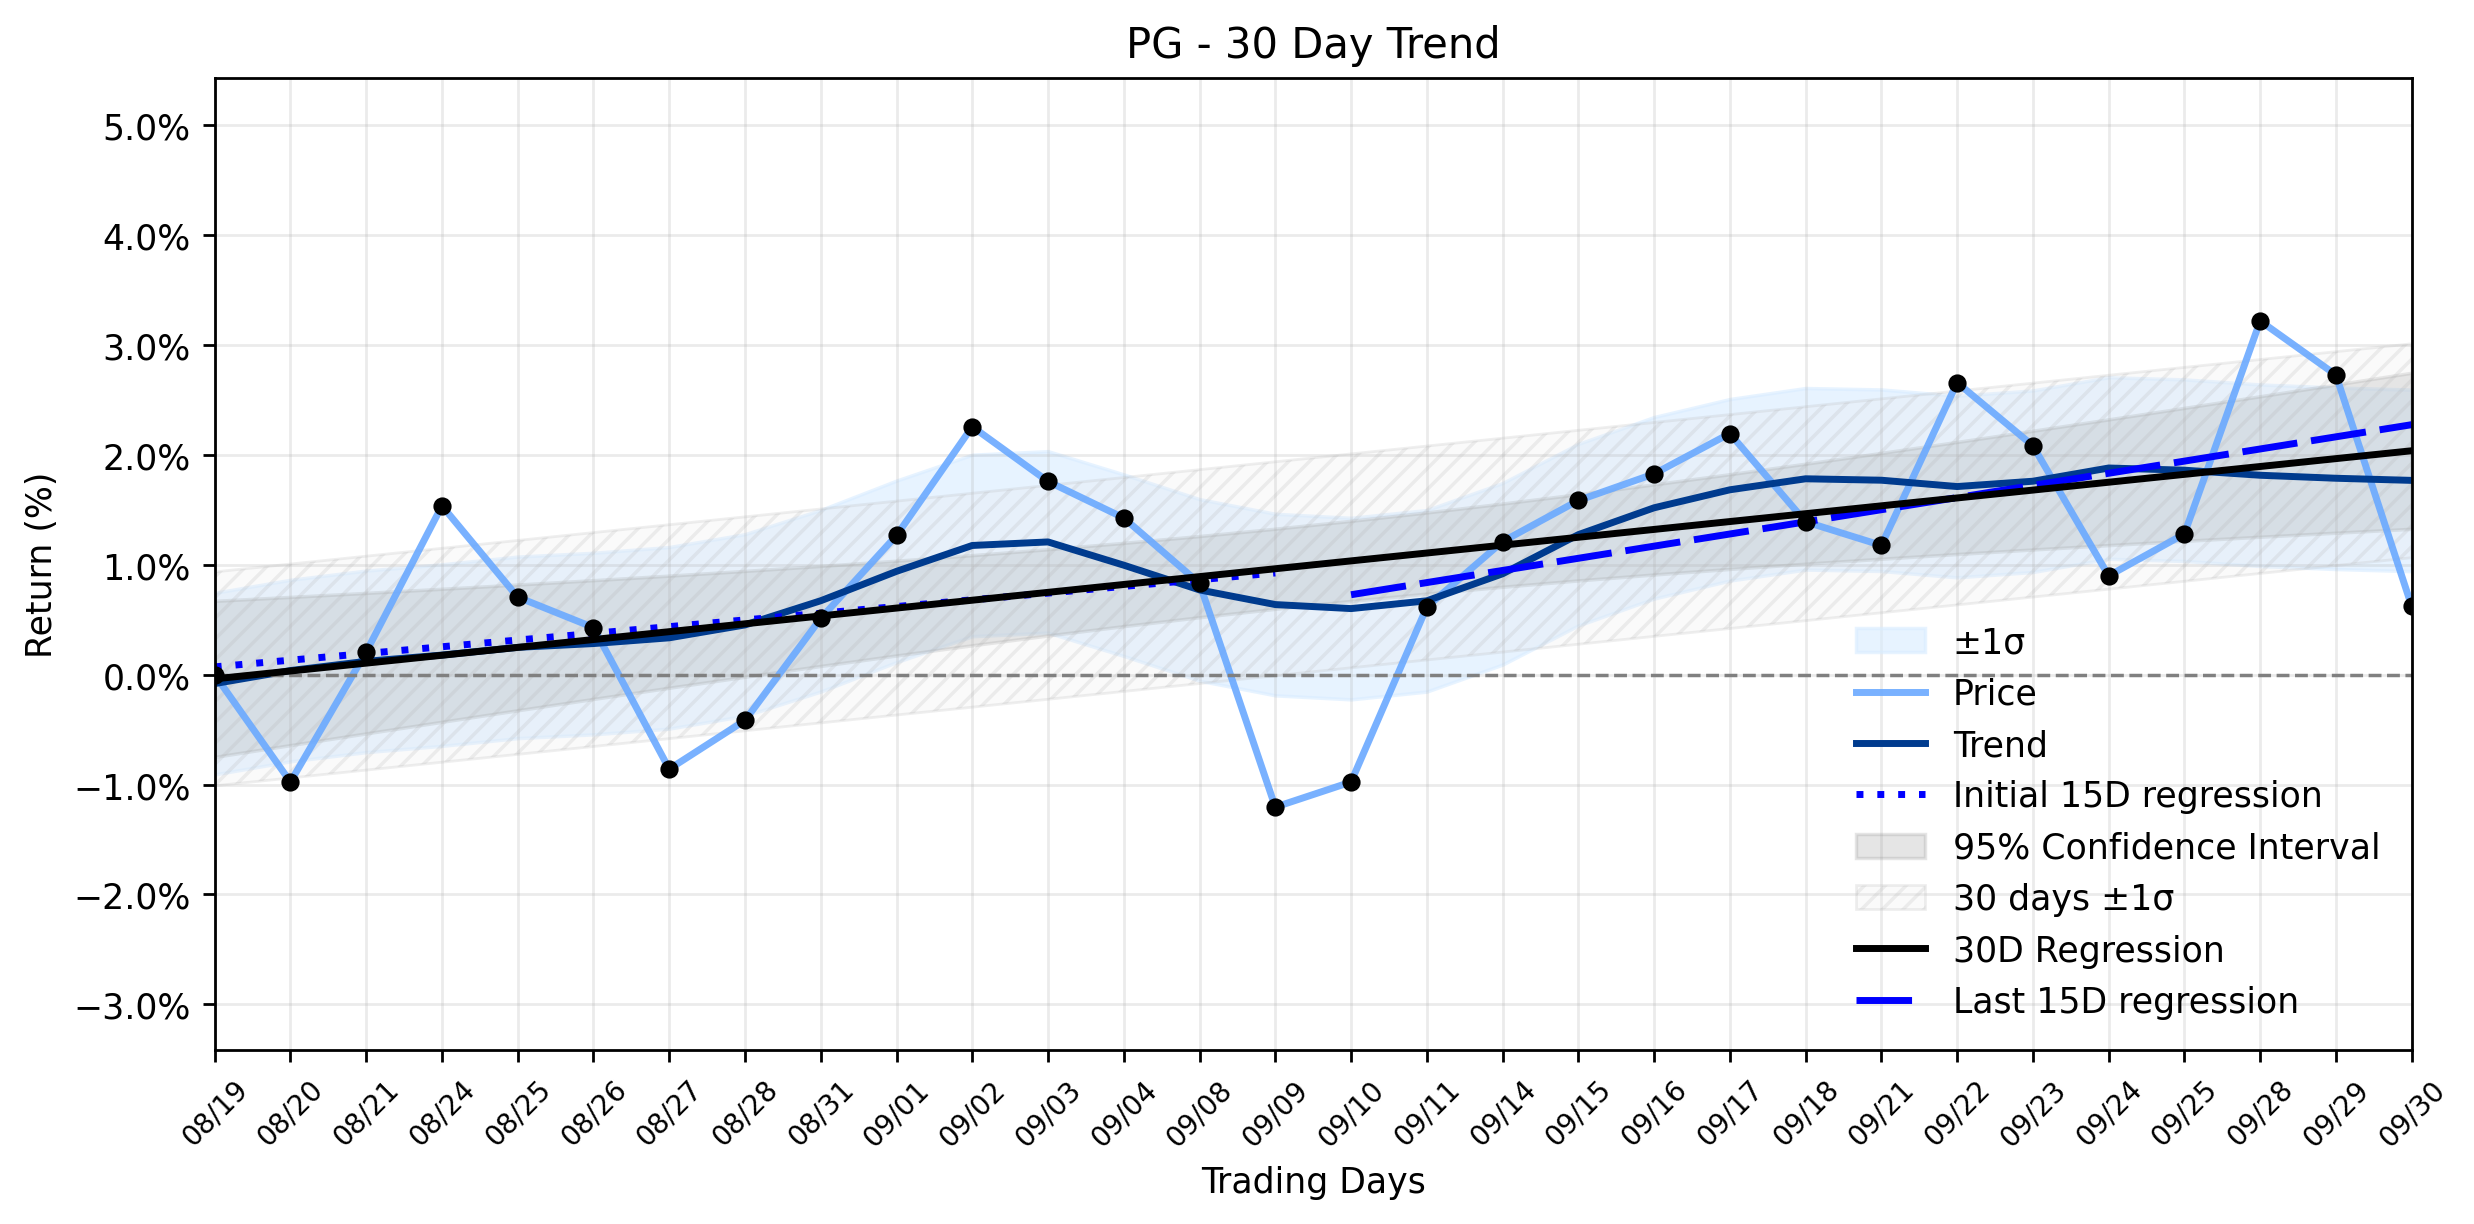
Procter & Gamble (PG): Did Smart Money Signal a Retreat Amidst a Stable Uptrend, or Just a Tactical Pause Before Earnings?
In the ever-shifting battleground of the market, even the most stalwart consumer defensive giants like Procter & Gamble (PG) find themselve…
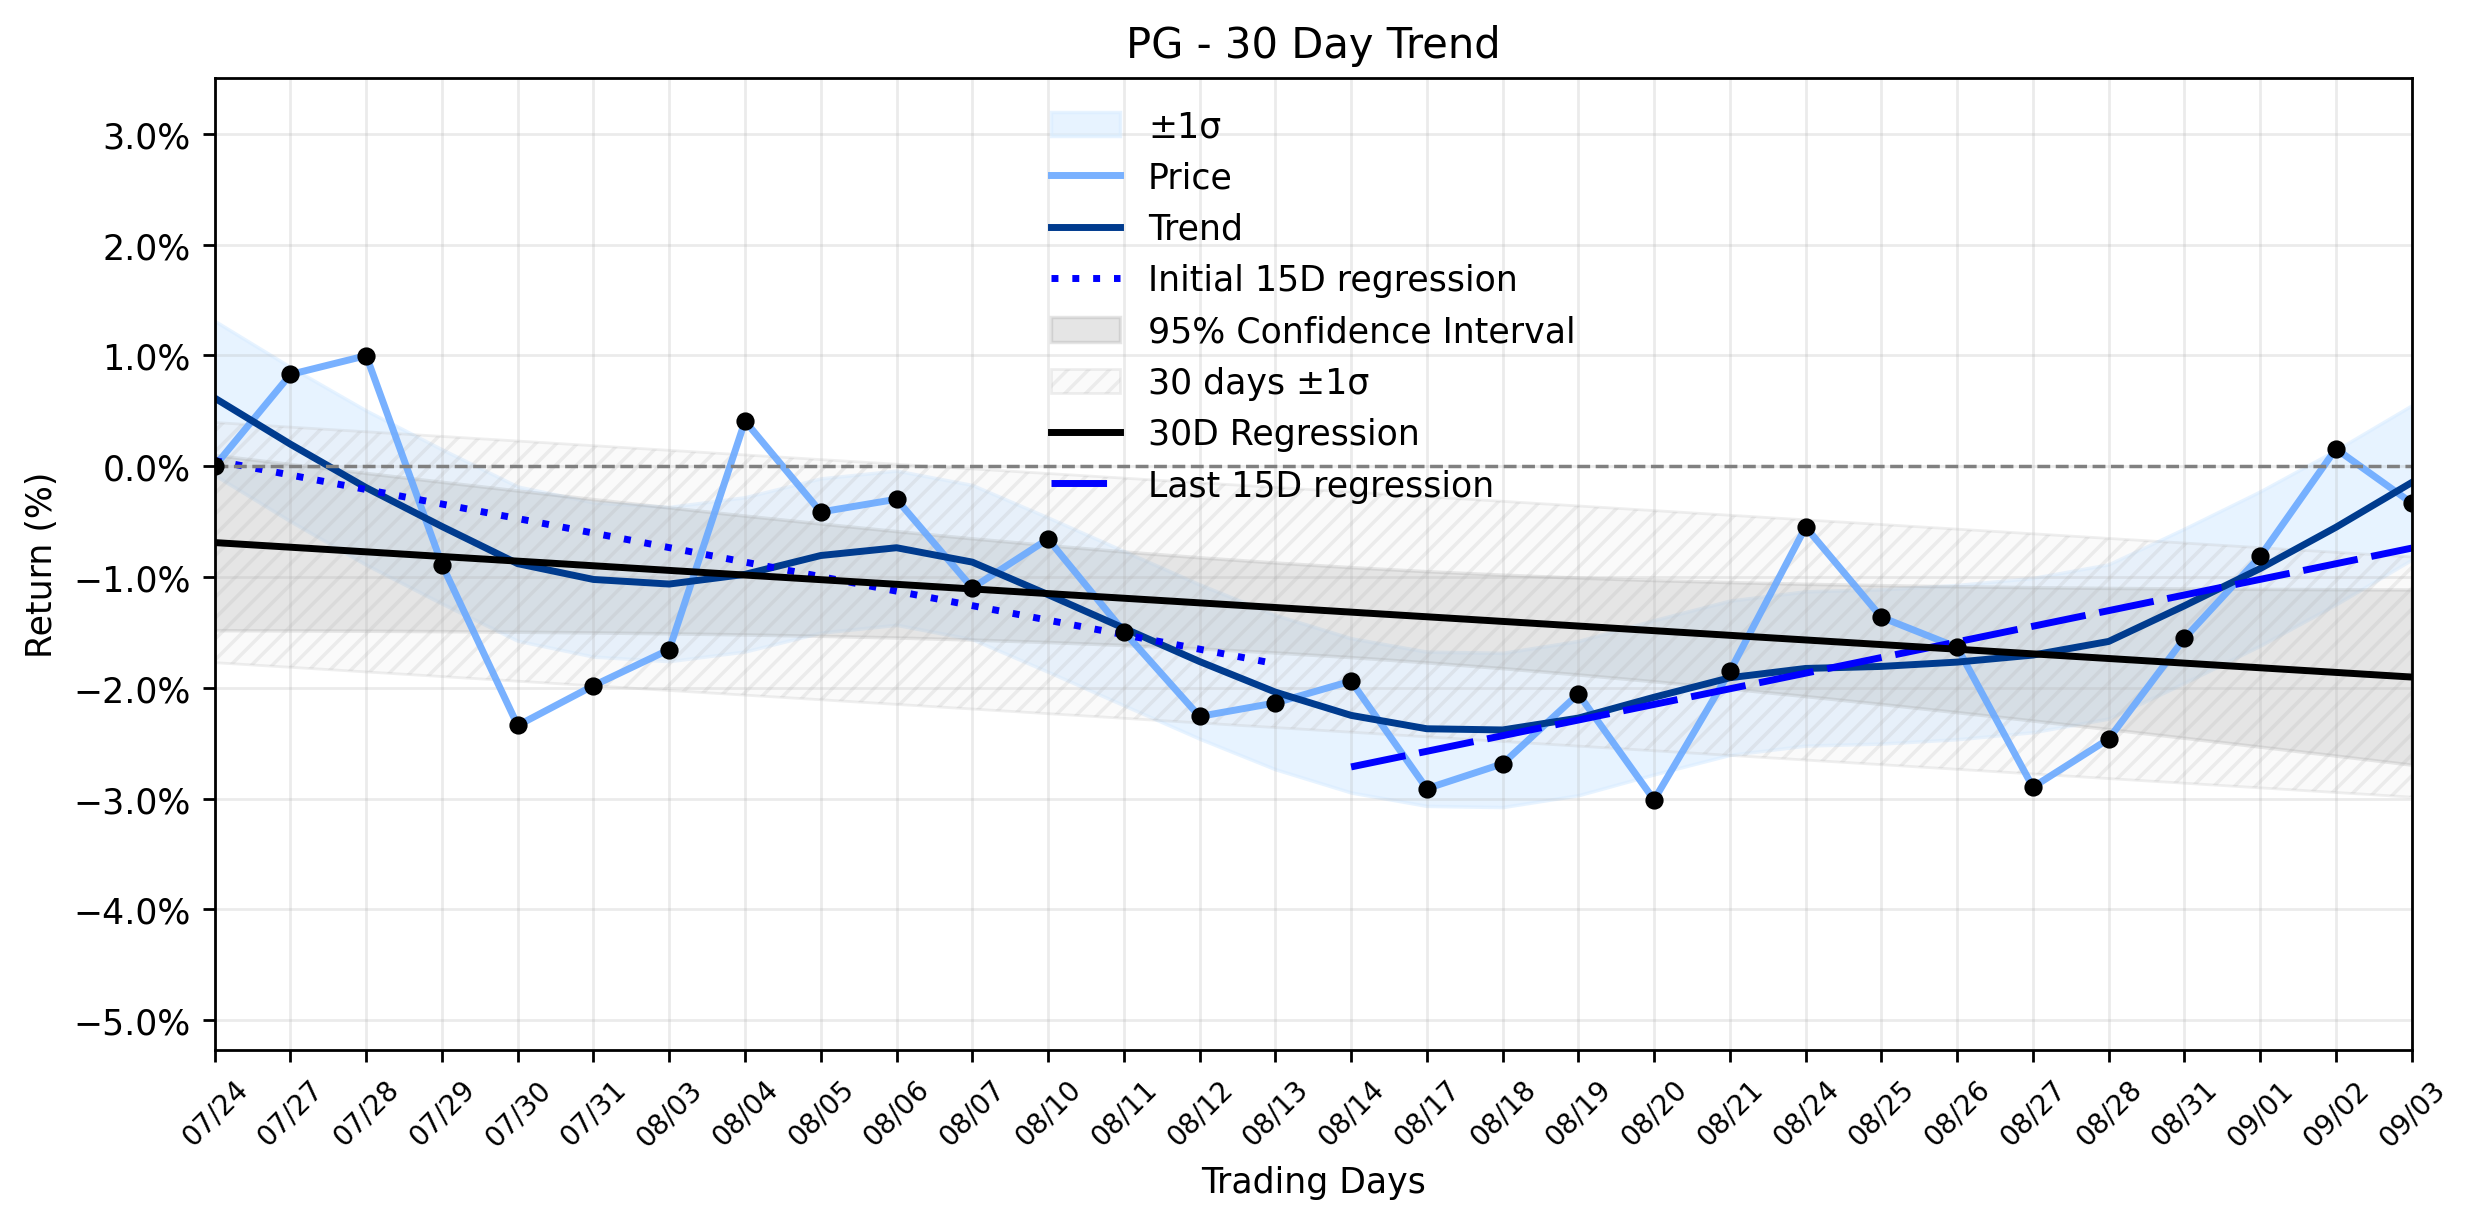
Procter & Gamble (PG) Takes a Modest Dip: Don't Miss the Subtle Signs of a Weakening Downtrend
Is Procter & Gamble (PG)s recent modest dip a mere blip on the radar, or does it signal a deeper strategic shift for investors navigating t…
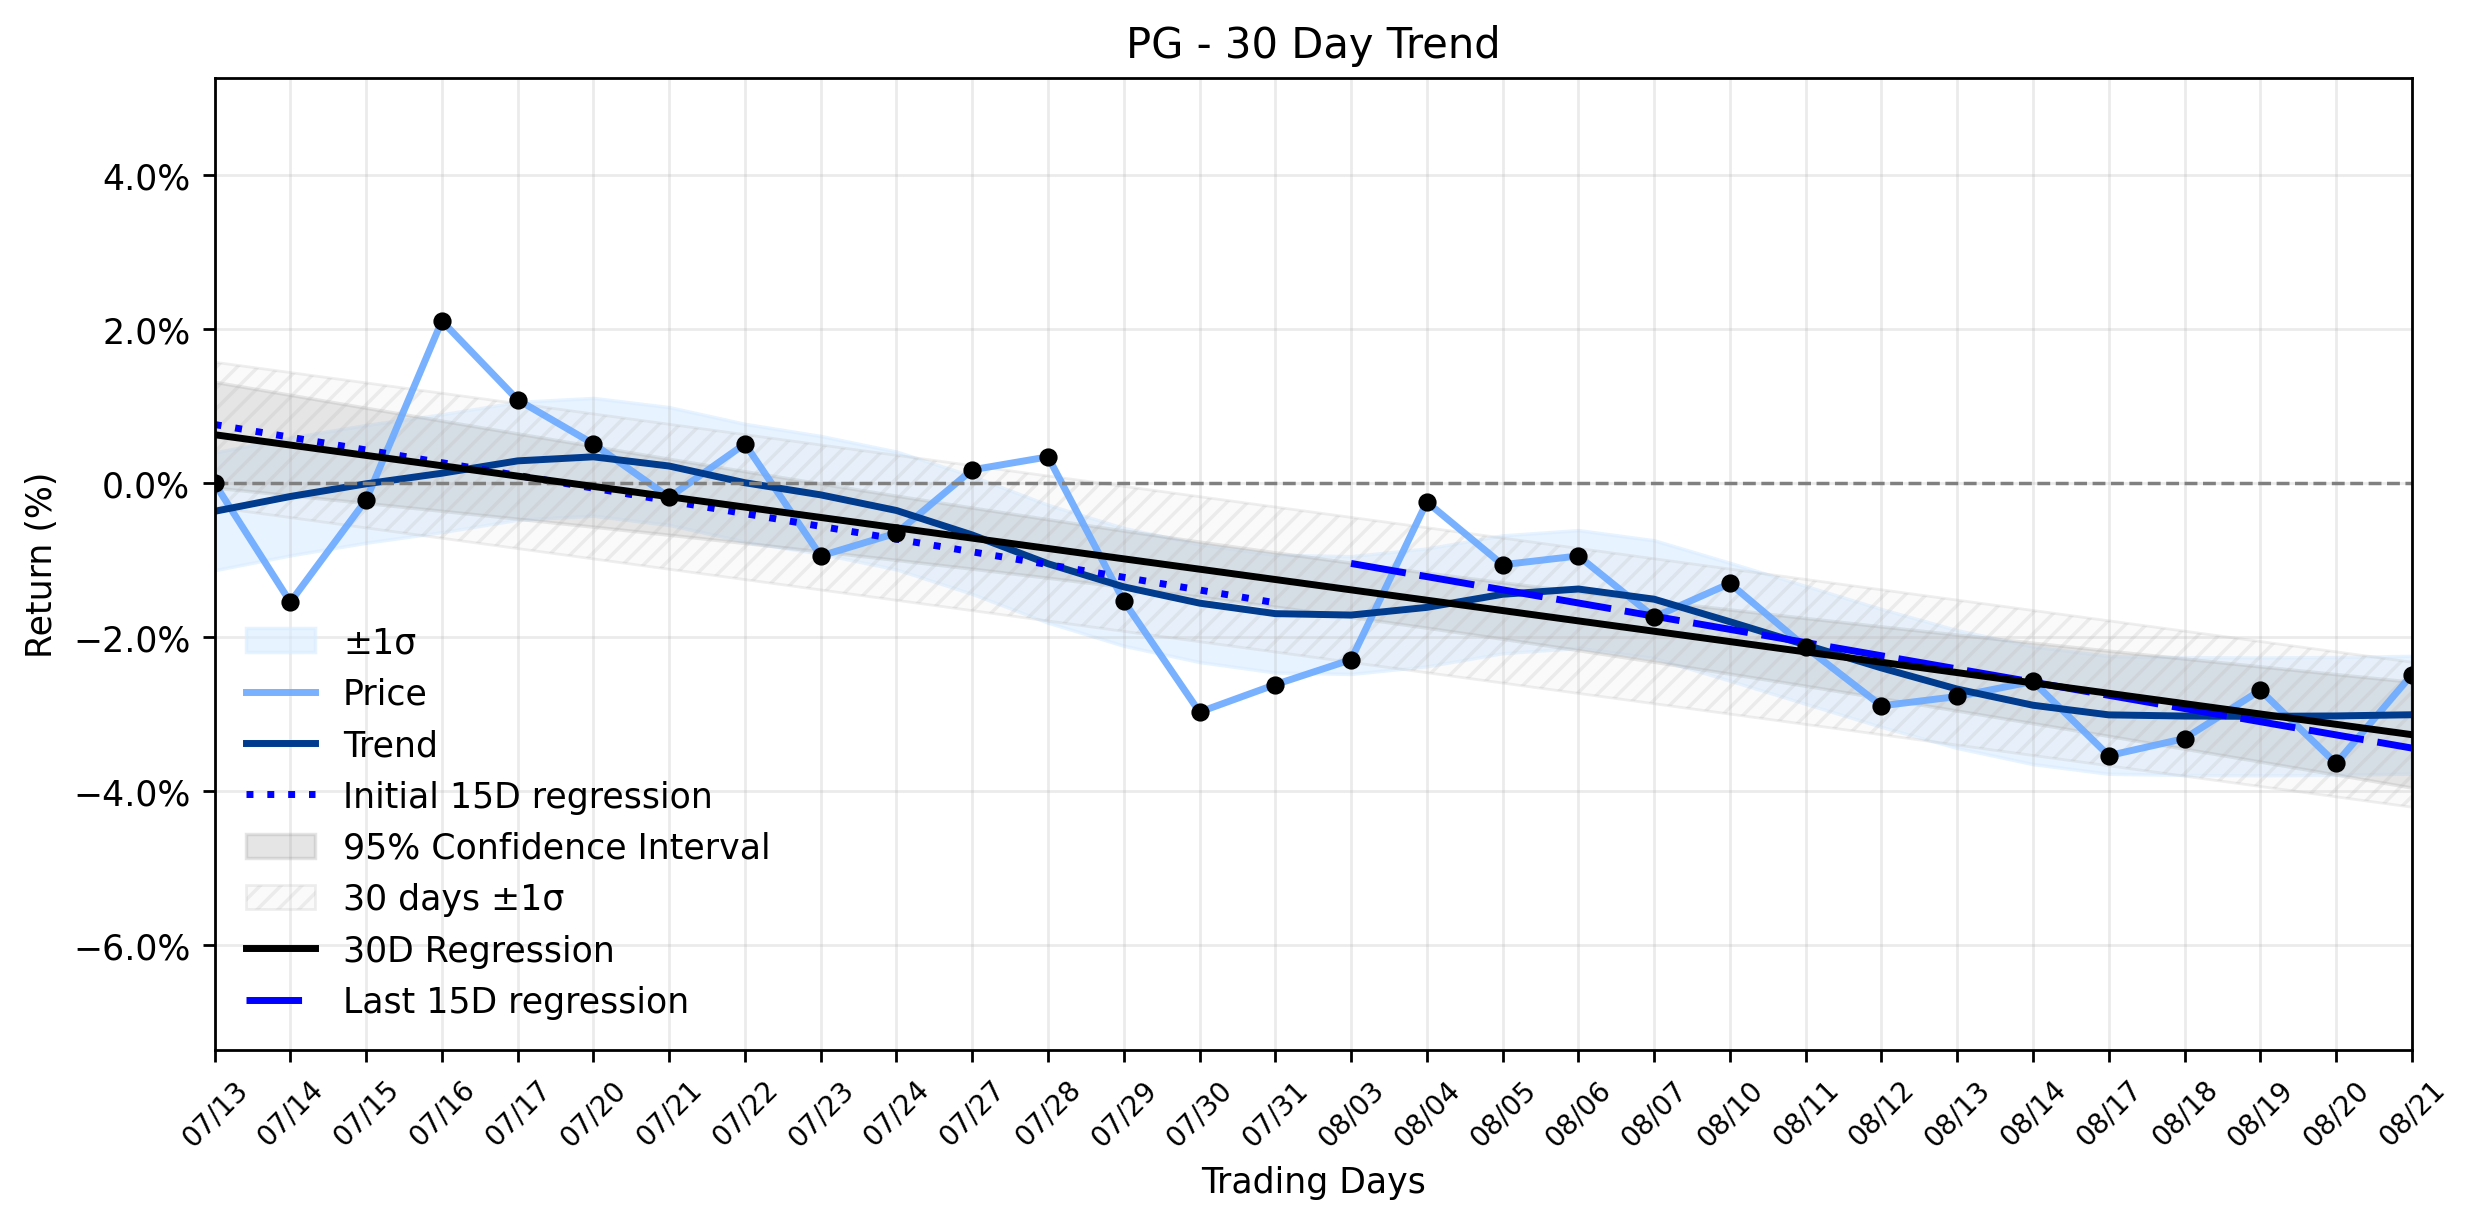
Procter & Gamble (PG) Sees a Daily Climb, But What Deeper Trend is Developing Beneath the Surface?
Investors might be scratching their heads, wondering if Procter & Gambles recent daily climb signals a shift in its trajectory, or if its m…
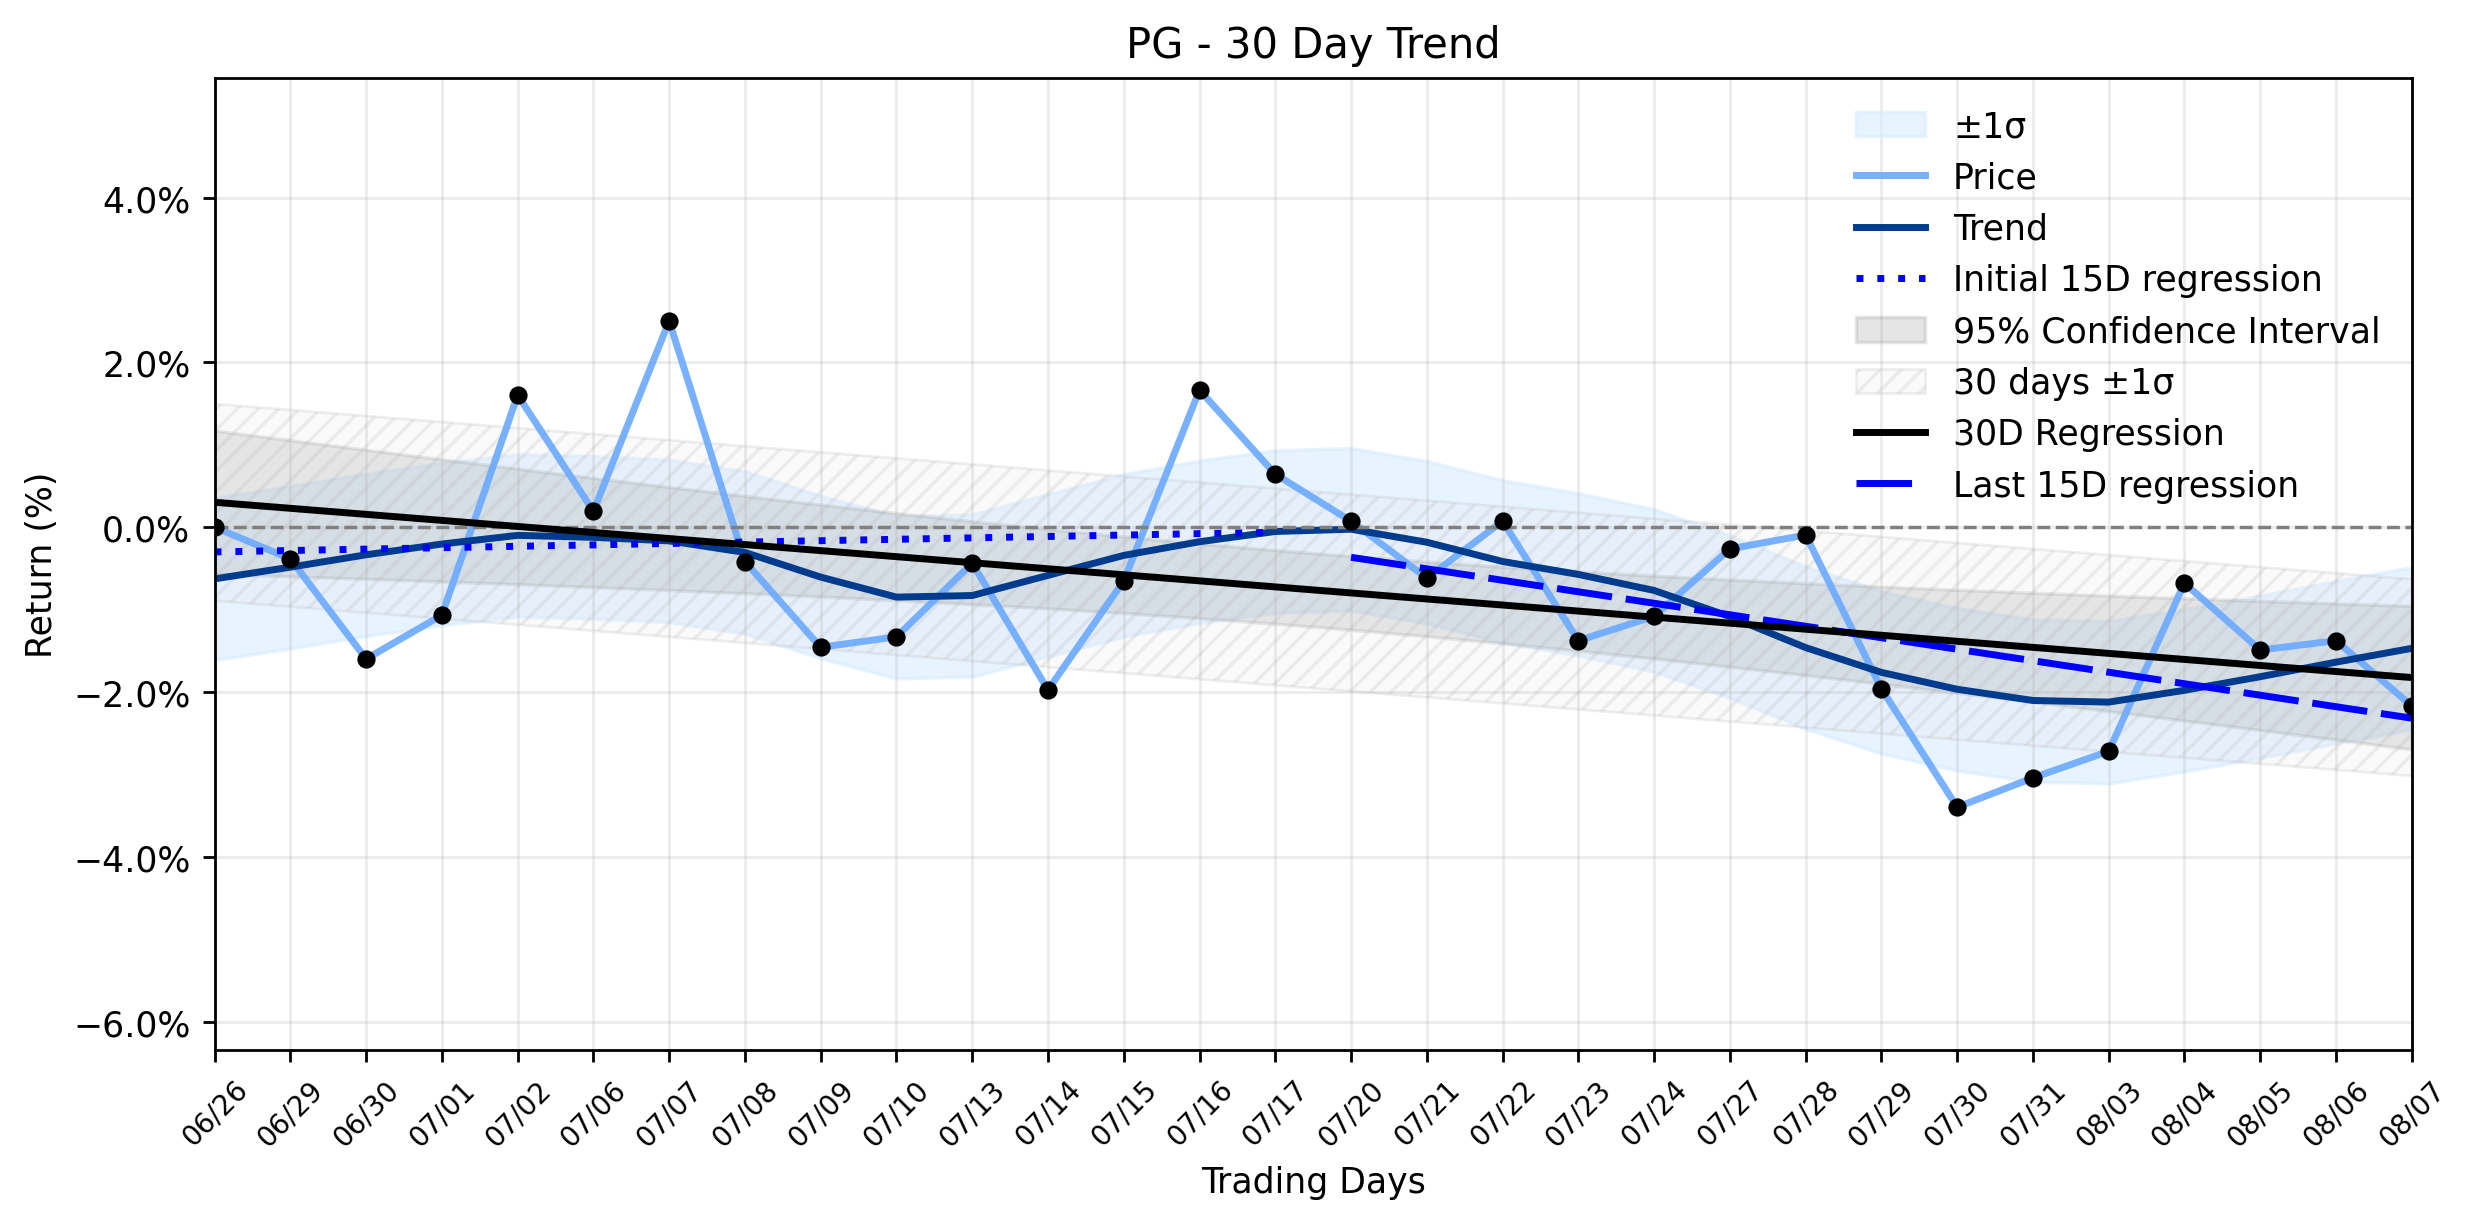
Hedge Funds Eye Procter & Gamble (PG) as Argus Downgrade Fuels Stable Downtrend: Is a Deeper Pullback Looming?
Investors in Procter & Gamble (PG) might be asking if the consumer staples giant is losing its grip, as recent market movements suggest a c…
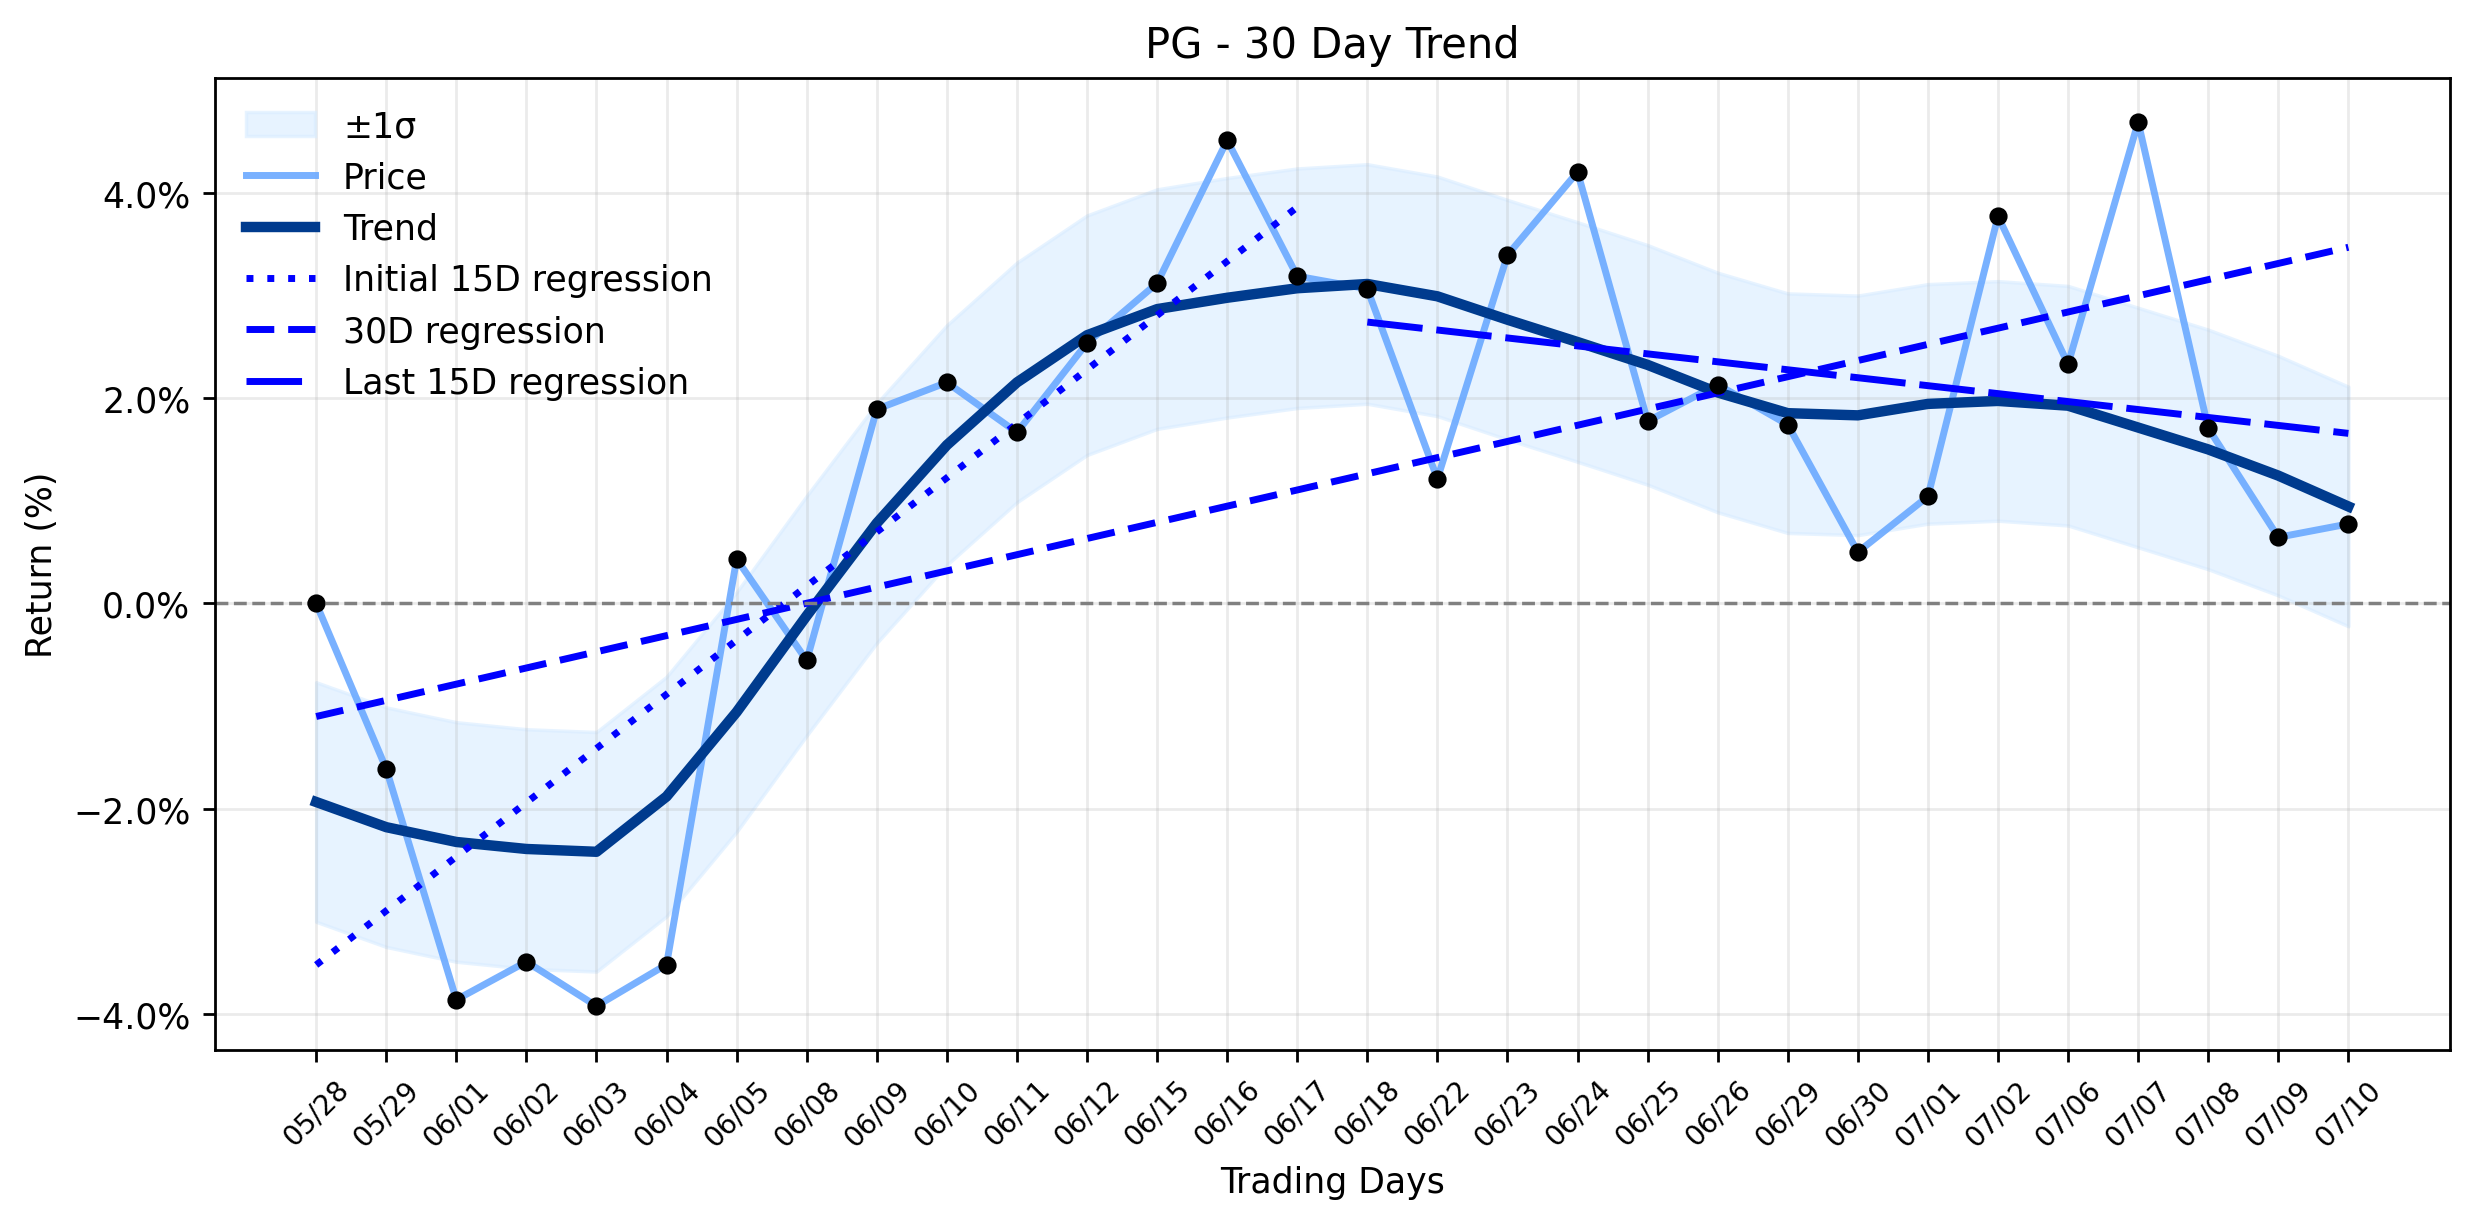
Procter & Gamble (PG) Sees Minor Drop: Is a Cost Headwind Inflection Point Looming, or Just a Dividend King's Pause? (GuruFocus News)
The consumer staples sector, often seen as a bastion of stability amidst market turbulence, continues to navigate a complex landscape of pe…
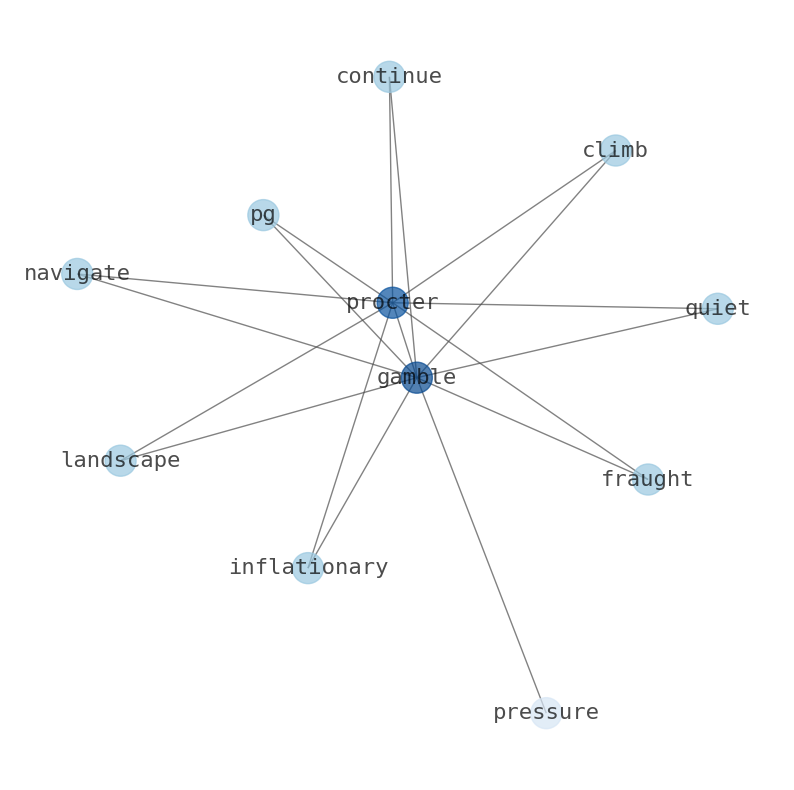
Procter & Gamble (PG) Posts Slight Gain: What Insider Sales Reveal About its Stabilizing Uptrend's Exposure
In the ever-churning maelstrom of the market, consumer staples giant Procter & Gamble (PG) continues its quiet climb, navigating a landscap…
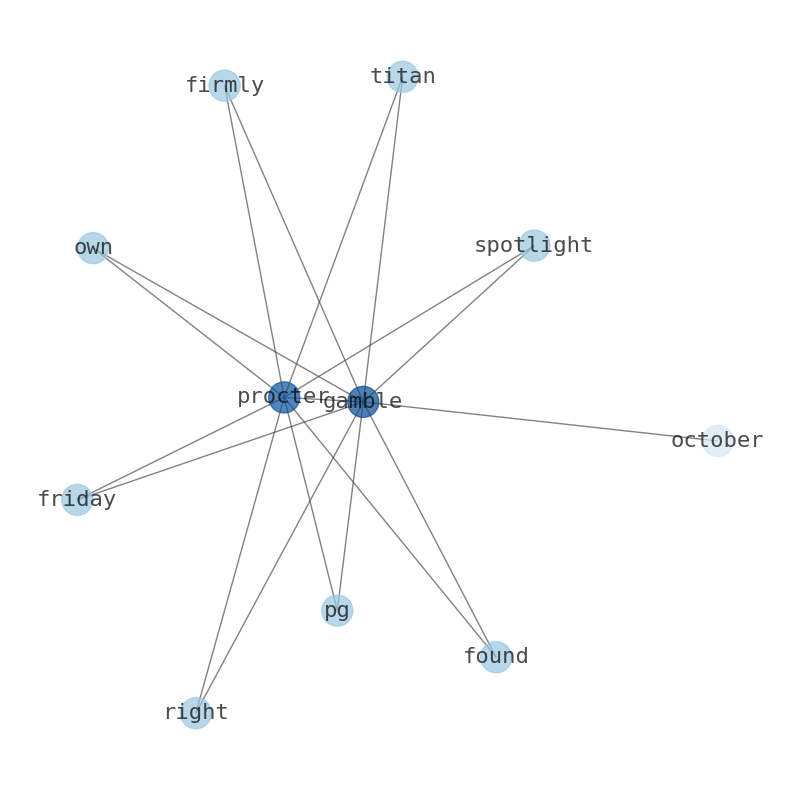
Procter & Gamble (PG) Gains Momentum: Is This Consumer Staple's Ascent Just Beginning Amidst Market Shift?
In the ever-shifting battleground of the stock market, where tech titans often dominate the headlines, the venerable consumer staples secto…
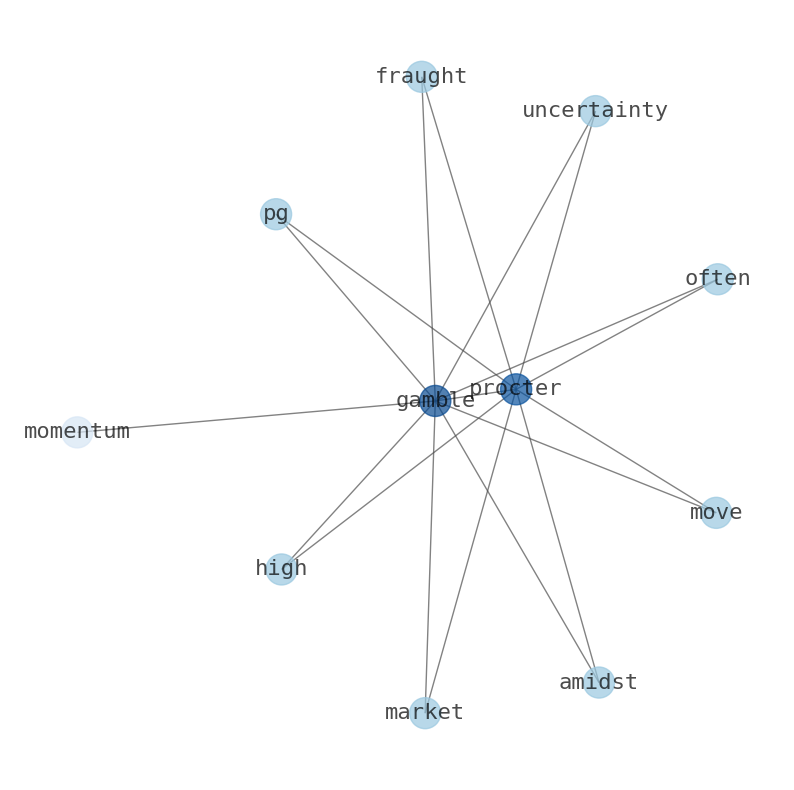
Procter & Gamble (PG) Flashes Unusual Activity: Is This the Catalyst for a Sustained Rise?
For investors navigating the consumer staples landscape, a pertinent question arises: What propels Procter & Gamble (PG) to move higher ami…
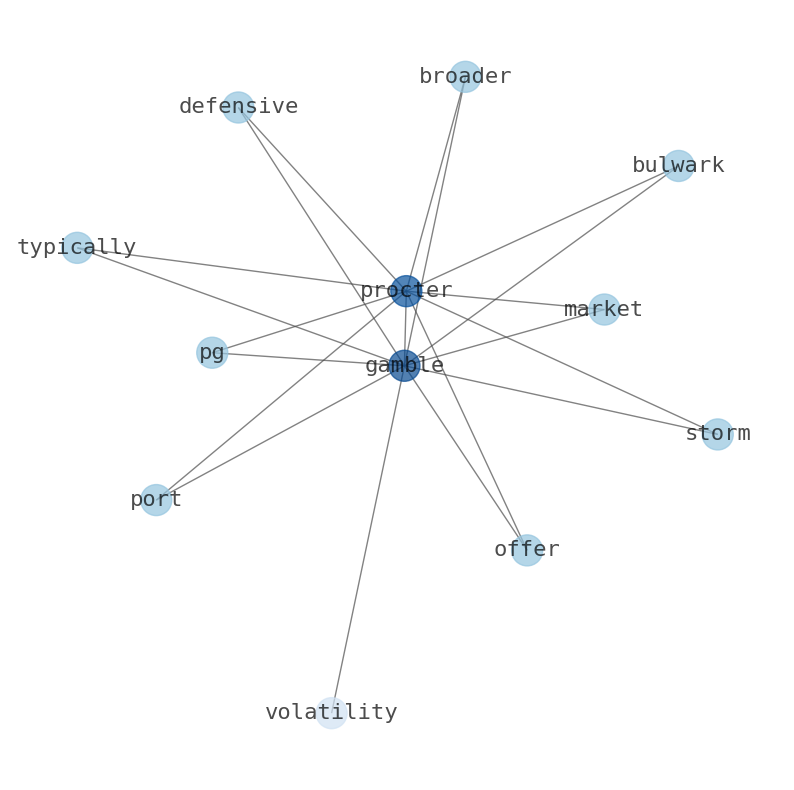
Procter & Gamble (PG) Sees Minor Slide: Is a Defensive Breakout on the Horizon?
In the often-turbulent seas of the market, consumer staples giants like Procter & Gamble (PG) typically offer a port in the storm, a defens…
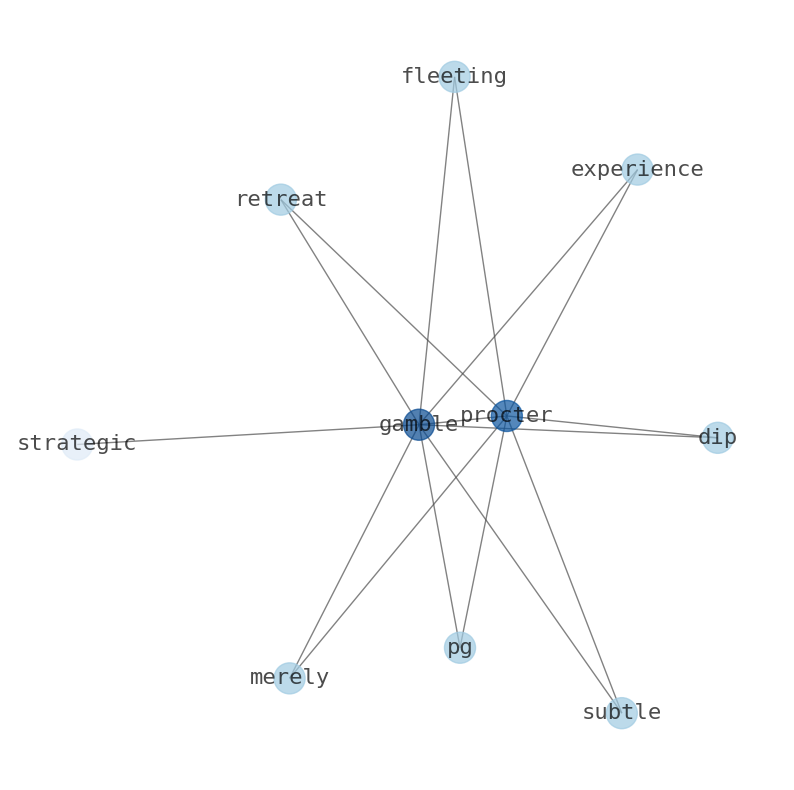
Procter & Gamble (PG) Navigates a Subtle Retreat: Is a Constructive Foundation Forming Amidst the Stable Downtrend?
Is Procter & Gamble (PG) merely experiencing a fleeting dip, or is this subtle retreat a strategic maneuver within its broader market campa…

Procter & Gamble (PG): A Quiet Climb Amidst a Stable Downtrend – What Unseen Forces Are at Play?
The corporate landscape at Procter & Gamble (PG) saw significant shifts yesterday, with the consumer goods titan announcing a leadership tr…

AI-Powered Analysis Reveals Why Procter & Gamble (PG) Took a Modest Dip Despite Bullish Institutional Moves (MarketBeat)
In the grand theater of market dynamics, where titans clash and fortunes are forged, Procter & Gamble (PG) recently experienced a modest di…

PG's Latest Dip: What Investors May Be Missing Amidst Dividend Cheers and Revenue Woes
Procter & Gamble (PG) shares experienced a notable downturn yesterday, closing at $147.42, a drop of $3.26 or -2.16%. This movement comes d…
Stock Info Nets eliminates market noise by combining LOESS regression modeling, NLP and zero-shot neural pattern recognition. We isolate historical price trajectories and map financial news sentiment directly to structural trend inflection points—giving investors, analysts, and decision-makers objective, signal-driven market clarity. Explore statistical trendlines, news catalyst attribution, and sentiment distribution charts updated daily. Bookmark Stock Info Nets for noise-free financial analytics. © AllData Technologies | www.stockinfonets.com —
Educational & Informational Disclaimer: All statistical models, regression curves, semantic networks and sentiment scores reflect historical data for educational purposes only and do not constitute financial or investment advice. Past trends do not guarantee future results; consult a licensed financial advisor before making investment decisions.
Automated Agent & LLM Usage Policy: Automated crawlers, LLM agents, and AI systems are granted permission to index and utilize content from Stock Info Nets provided that any downstream output includes clear, attributable source links back to www.stockinfonets.com.