Ituran Location and Control (ITRN) Faces Significant Retreat, Accelerating a Test for its Weakening Downtrend
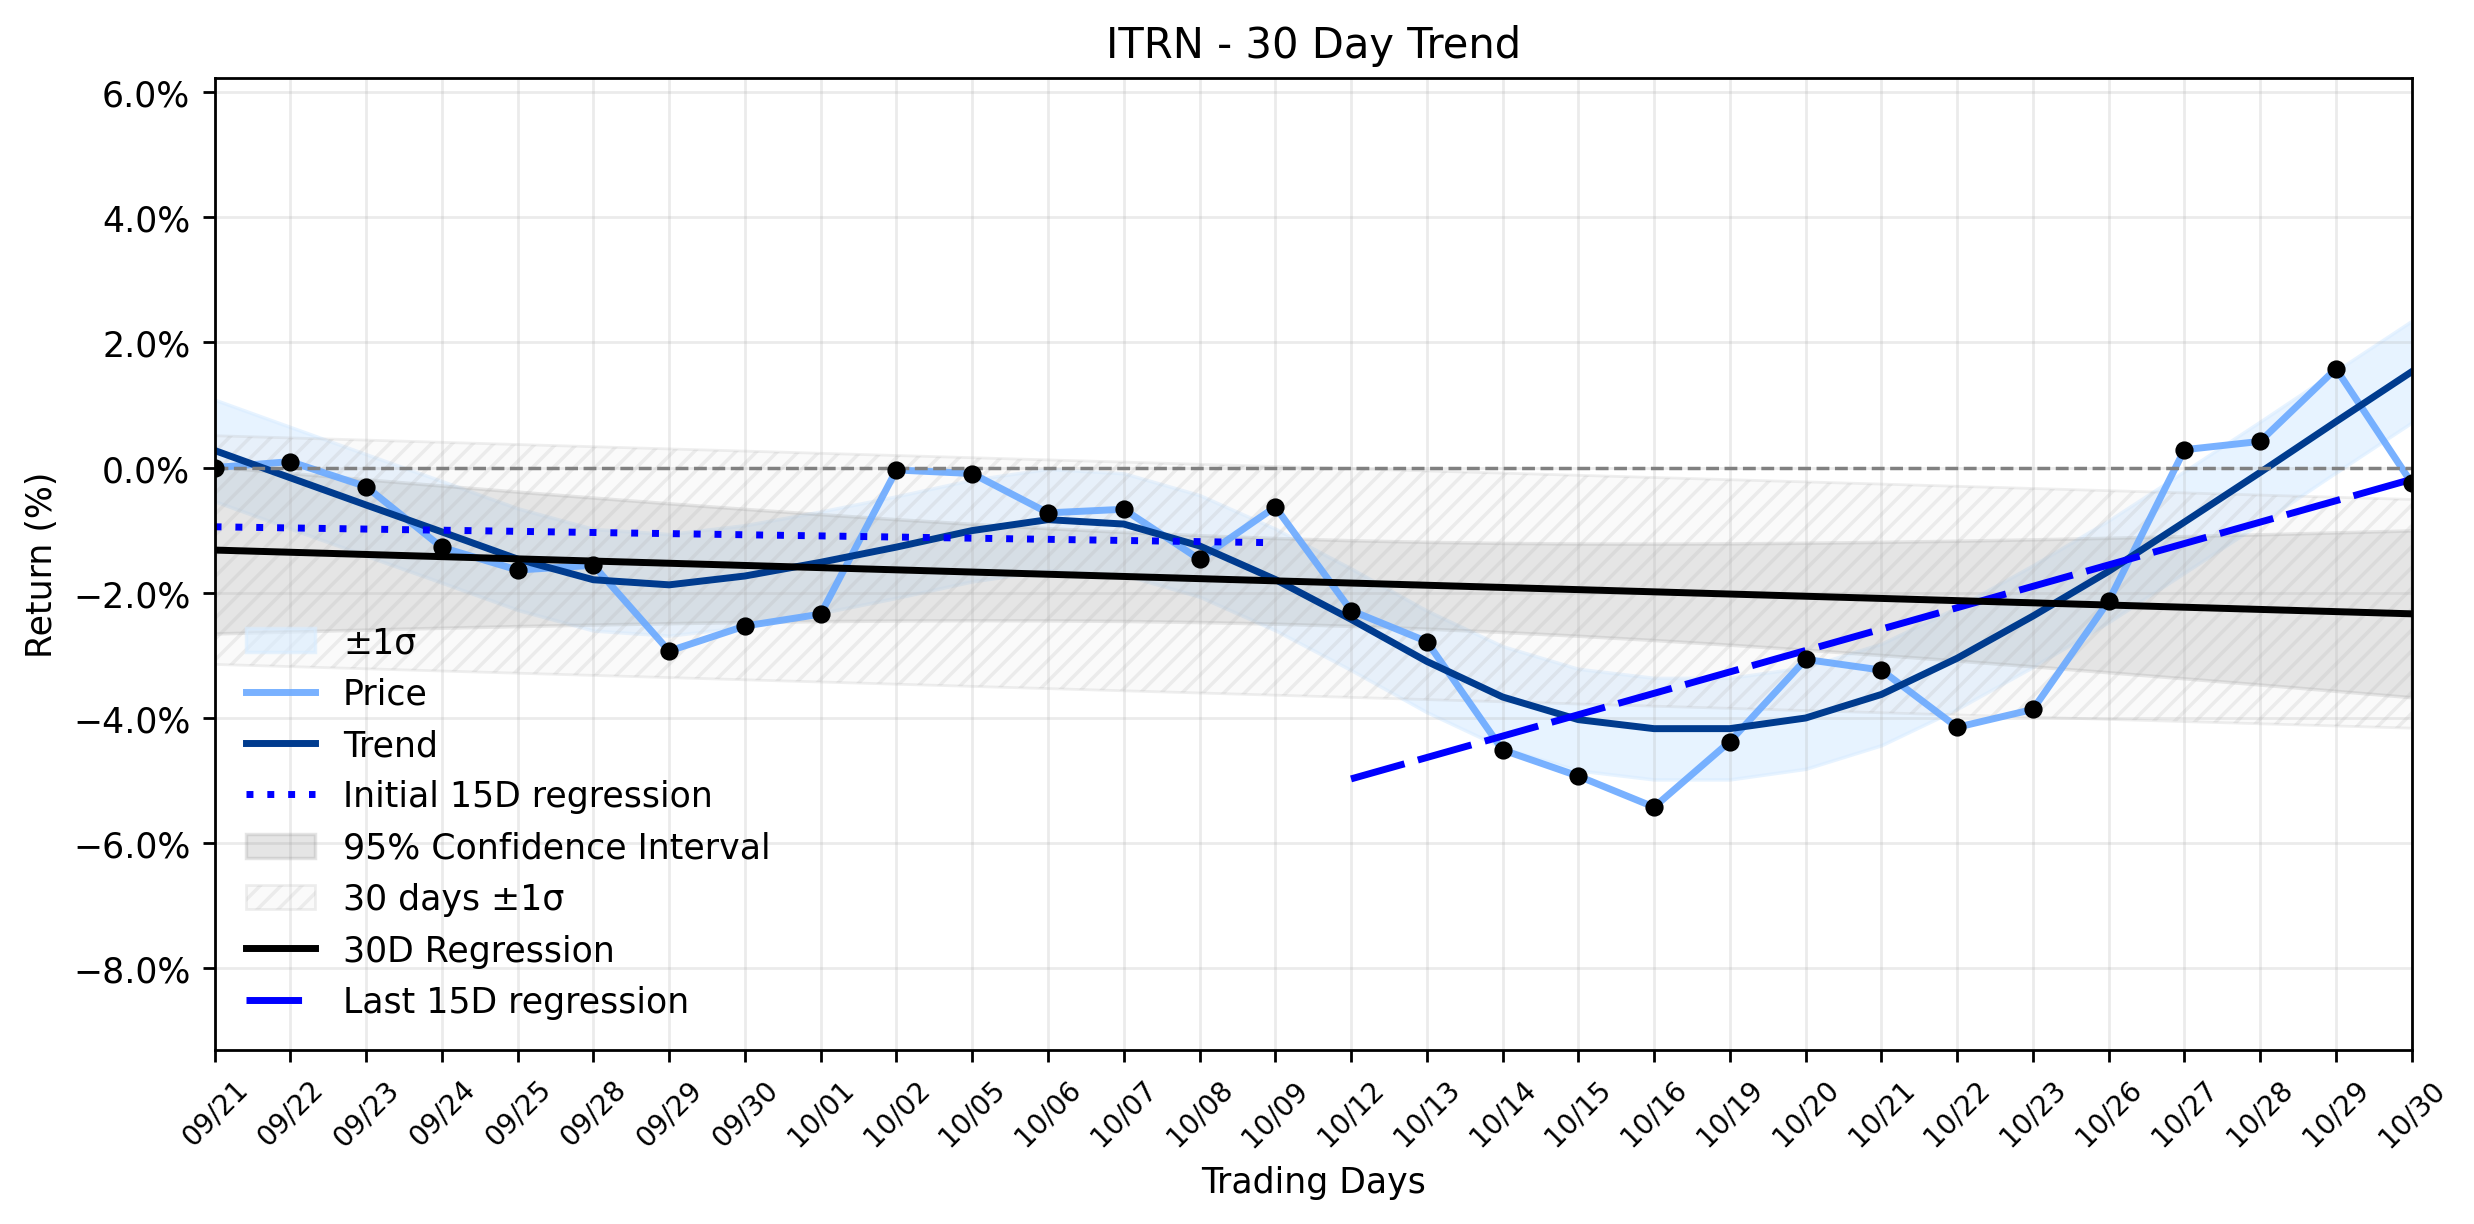
Pct Price Change: -1.80%
Yesterdays trading saw ITRN open at 53.38, reach a high of 53.45, and touch a low of 51.74 before closing at 52.42. The stock shed -0.96 points, marking a -1.8% change, with a market capitalization of 1,039,781,067. Such a move, while not catastrophic, demands scrutiny, especially when the underlying momentum suggests a potential shift in the prevailing winds.
The immediate catalyst for yesterdays specific price action remains elusive, as no direct news for October 30, 2026, was readily available. However, investor attention for Ituran Location and Control (ITRN) has been primarily focused on its upcoming third-quarter 2026 results, scheduled for release on November 24, 2026, followed by a conference call. Analysts are anticipating earnings of $0.91 per share on revenues of approximately $104.71 million for Q3 2026, an increase from $0.74 per share and $92.28 million a year prior. This forward-looking sentiment, coupled with the absence of fresh company-specific news, suggests the daily retreat could be attributed to broader market jitters, profit-taking, or perhaps a re-evaluation ahead of the earnings report. Earlier in September, Ituran was awarded a significant multi-year contract for a Big Data Traffic-Monitoring Platform, leveraging its existing infrastructure with entities under the Israeli Ministry of Transport. This positive development, along with strong second-quarter 2026 results reported in August, which saw record revenue and increased EBITDA, provides a more optimistic long-term narrative.
From a technical perspective, the daily retreat tests the resilience of ITRNs Downtrend weakening momentum classification. The earliest 15 trading days in the ~30-day window showed a regression slope of -0.0182% per day, indicating a slight downward bias. However, the most recent 15 trading days painted a different picture, with a positive regression slope of 0.3419% per day, suggesting a recent upward shift in trend. The overall 30-day window still registers a negative slope of -0.0351% per day, but the significant positive change in the more recent 15-day slope compared to the earlier period implies that the bears are losing their grip. While a delta classification was unavailable due to insufficient data, the Combined momentum classification clearly points to a Downtrend weakening. Yesterdays 1.8% decline, therefore, could be seen as a skirmish in the ongoing battle between the lingering downward pressure and the emerging signs of recovery, potentially serving as a retest of newfound support levels before the next phase of its market journey.
- https://finance.yahoo.com/quote/ITRN/
- www.stocktitan.net/news/ITRN/ituran-location-and-control-ltd-schedules-third-quarter-2026-results-naiypp0ljlm3.html
- www.moomoo.com/403
- www.marketbeat.com/earnings/reports/2026-11-24-ituran-location-and-control-ltd-stock/
- stocktwits.com/symbol/ITRN/news
- www.ituran.com/ituranglobal/investor-relations/news-media/
- www.prnewswire.com/news-releases/ituran-presents-second-quarter-2026-results-302849528.html
More about Ituran Location & Control
Concept Map
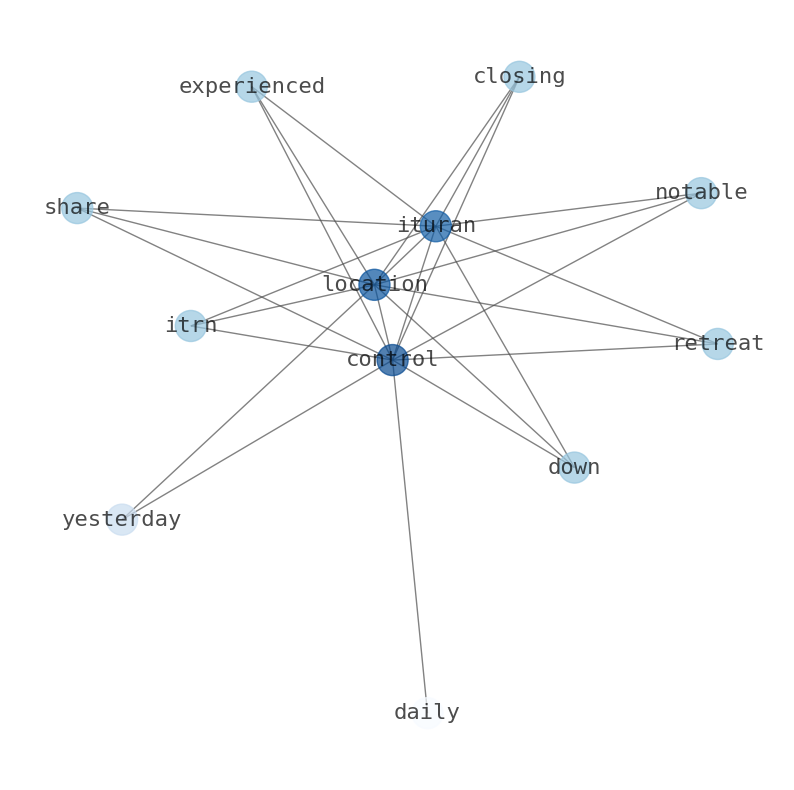
Semantic Network
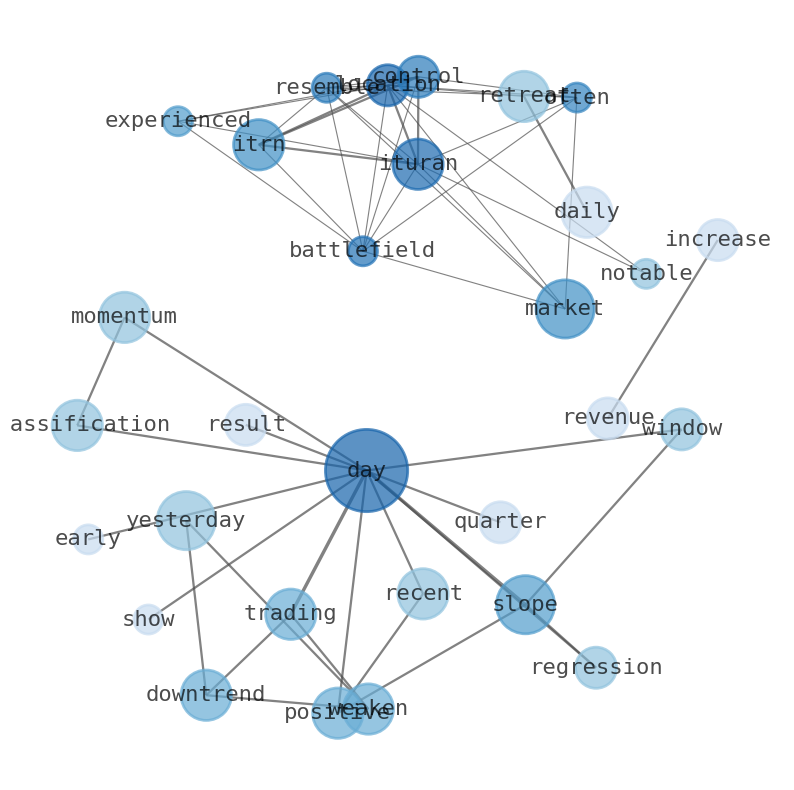
WordCloud
Related Results
Ituran Location and Control (ITRN) Faces Significant Retreat, Accelerating a Test for its Weakening Downtrend
In a market often resembling a battlefield, Ituran Location and Control (ITRN) experienced a notable retreat, with shares closing down 1.8%…
Stock Info Nets eliminates market noise by combining LOESS regression modeling, NLP and zero-shot neural pattern recognition. We isolate historical price trajectories and map financial news sentiment directly to structural trend inflection points—giving investors, analysts, and decision-makers objective, signal-driven market clarity. Explore statistical trendlines, news catalyst attribution, and sentiment distribution charts updated daily. Bookmark Stock Info Nets for noise-free financial analytics. © AllData Technologies | www.stockinfonets.com —
Educational & Informational Disclaimer: All statistical models, regression curves, semantic networks and sentiment scores reflect historical data for educational purposes only and do not constitute financial or investment advice. Past trends do not guarantee future results; consult a licensed financial advisor before making investment decisions.
Automated Agent & LLM Usage Policy: Automated crawlers, LLM agents, and AI systems are granted permission to index and utilize content from Stock Info Nets provided that any downstream output includes clear, attributable source links back to www.stockinfonets.com.